Scripts
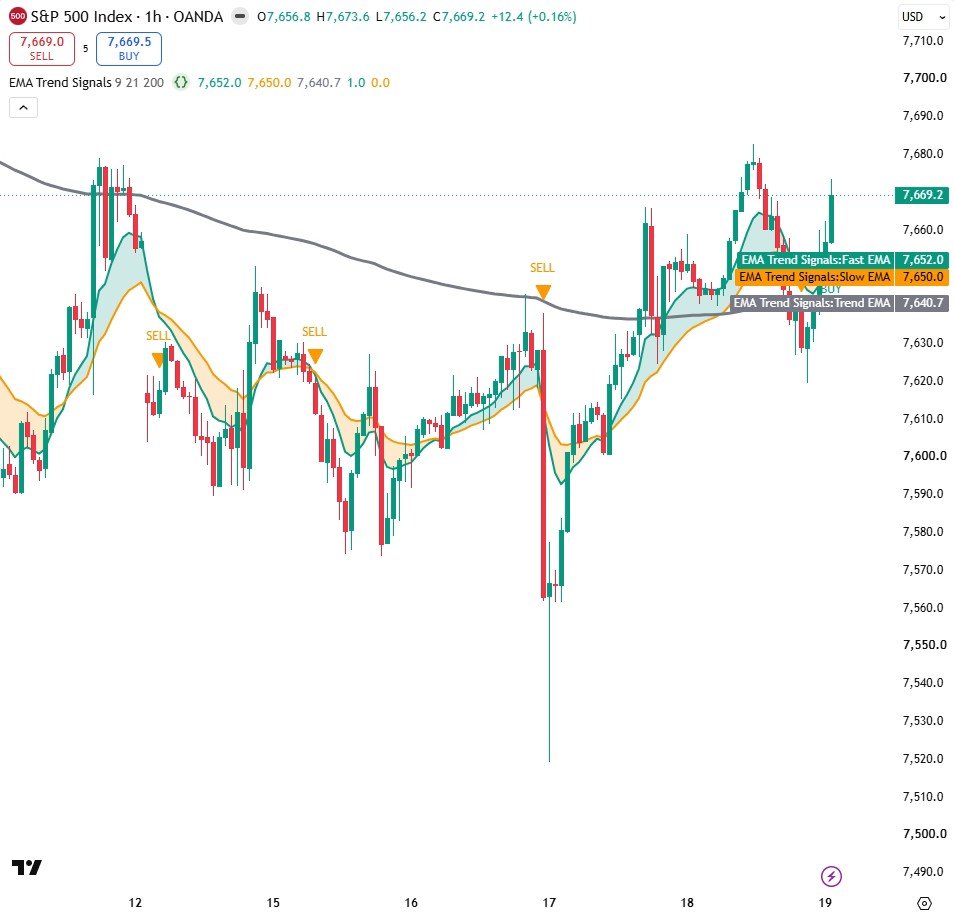
EMA Trend Signals
Fast/slow EMA crossover signals filtered by a 200 EMA trend line, with a trend-coloured fill, non-repainting BUY/SELL labels and alert conditions.
View code & snapshots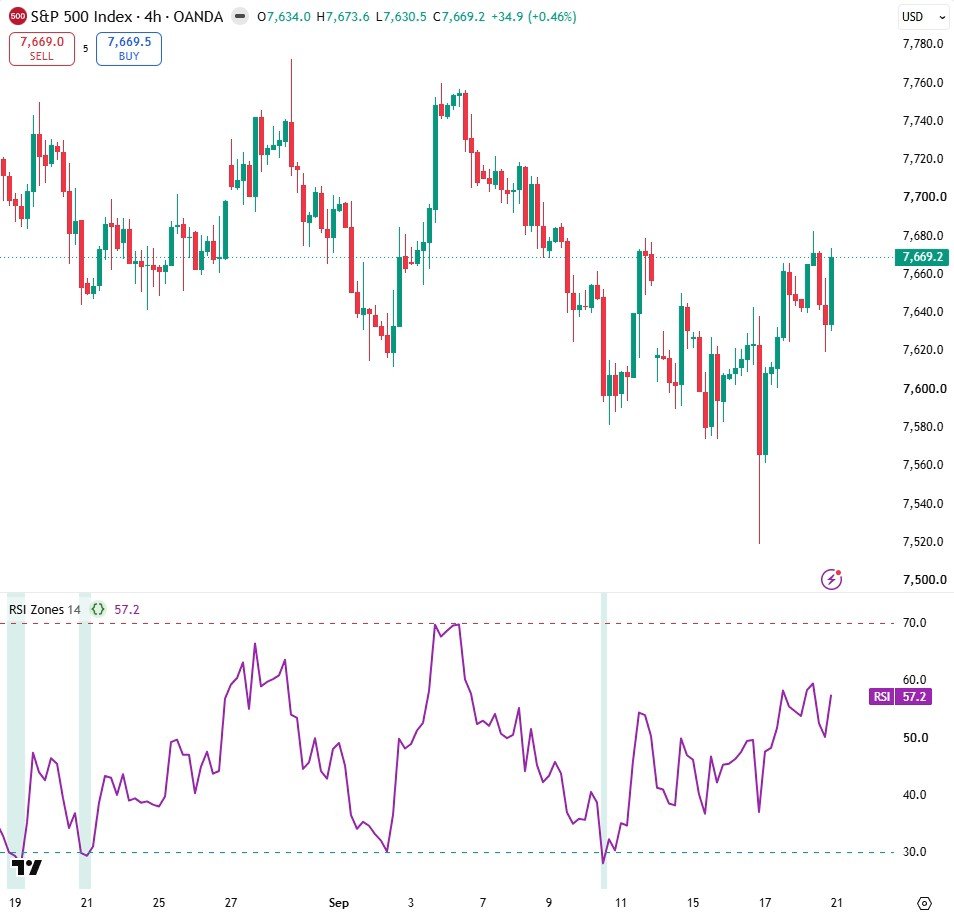
RSI Zones
A clean RSI in its own pane with 70/30 levels and a background that turns red when overbought and teal when oversold.
View code & snapshots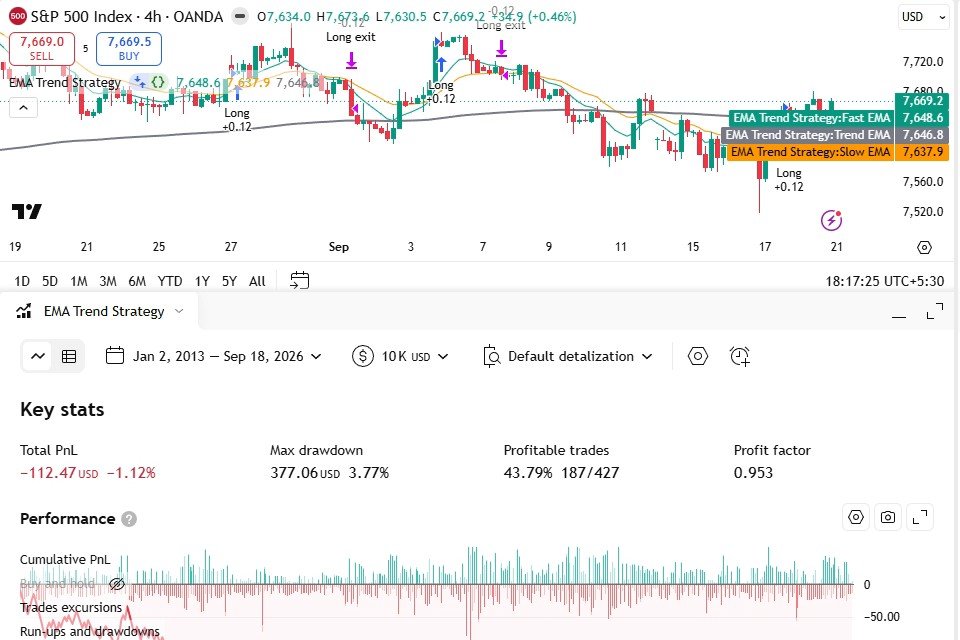
EMA Trend Strategy
The EMA trend idea as a backtestable strategy: realistic commission and slippage, ATR stop-loss and take-profit, and JSON alert messages ready for webhook automation.
View code & snapshots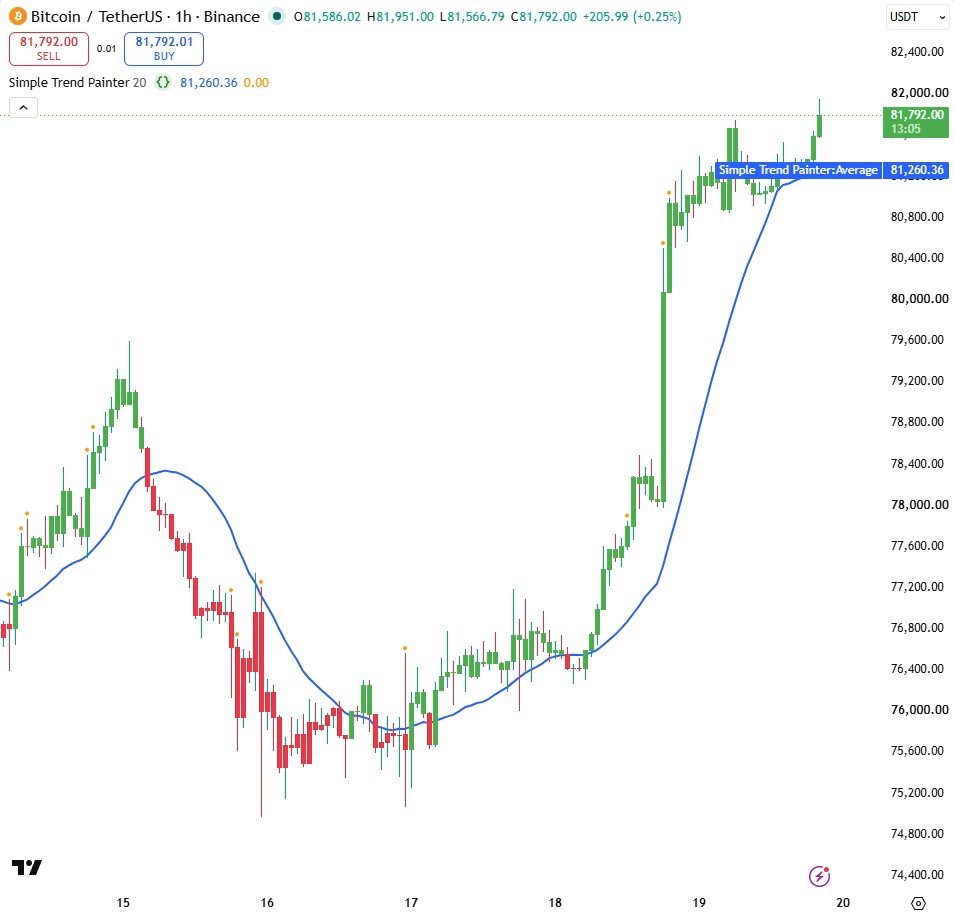
Simple Trend Painter
A beginner-friendly first indicator: candles painted green above a moving average and red below it, an orange dot on unusually busy candles, and an alert when price crosses the average.
View code & snapshots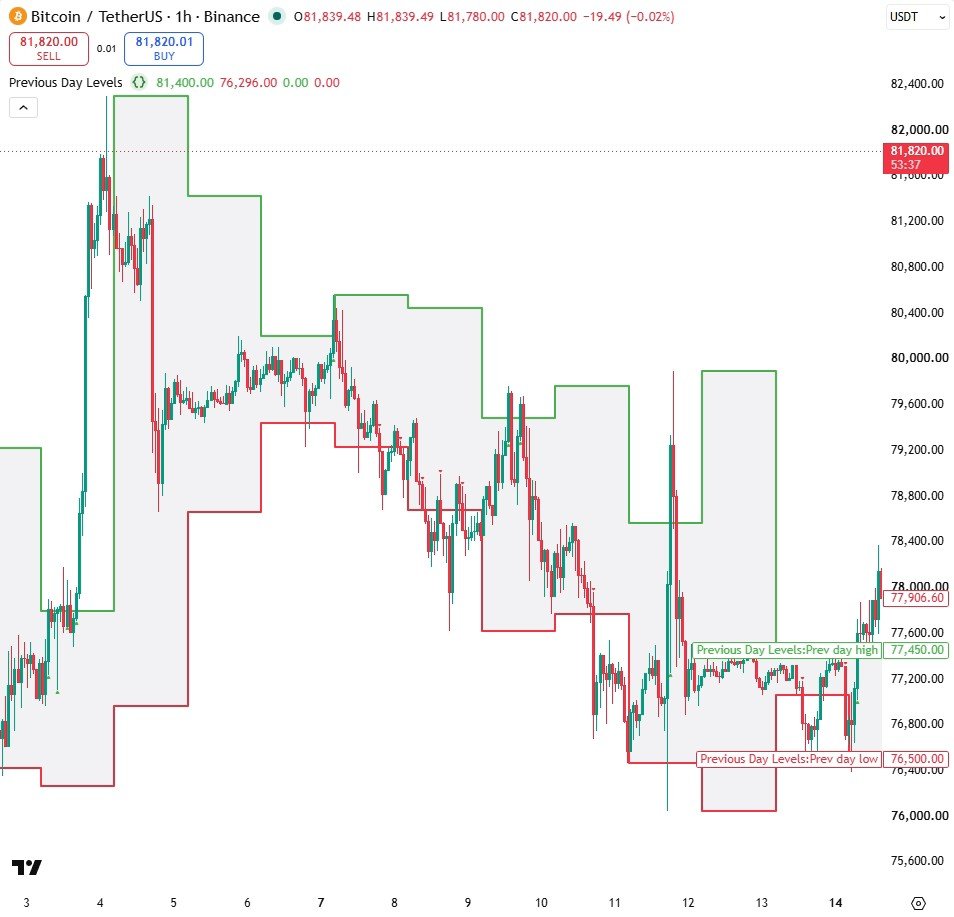
Previous Day Levels
Yesterday's high and low drawn automatically on any chart and timeframe, with the range shaded, breakout markers and alerts. Non-repainting: it reads the previous completed daily candle.
View code & snapshots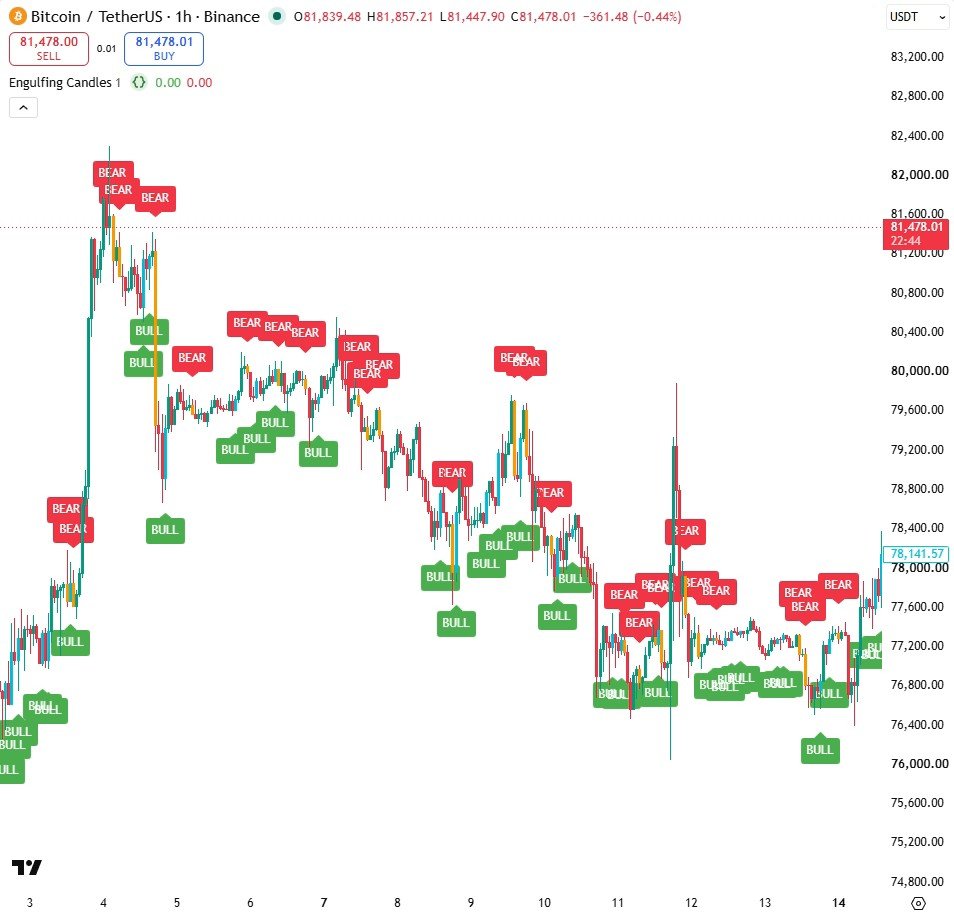
Engulfing Candles
Finds bullish and bearish engulfing candles automatically, labels them BULL and BEAR, paints the candle itself, and sends alerts. A body-size ratio filters out the weak patterns.
View code & snapshots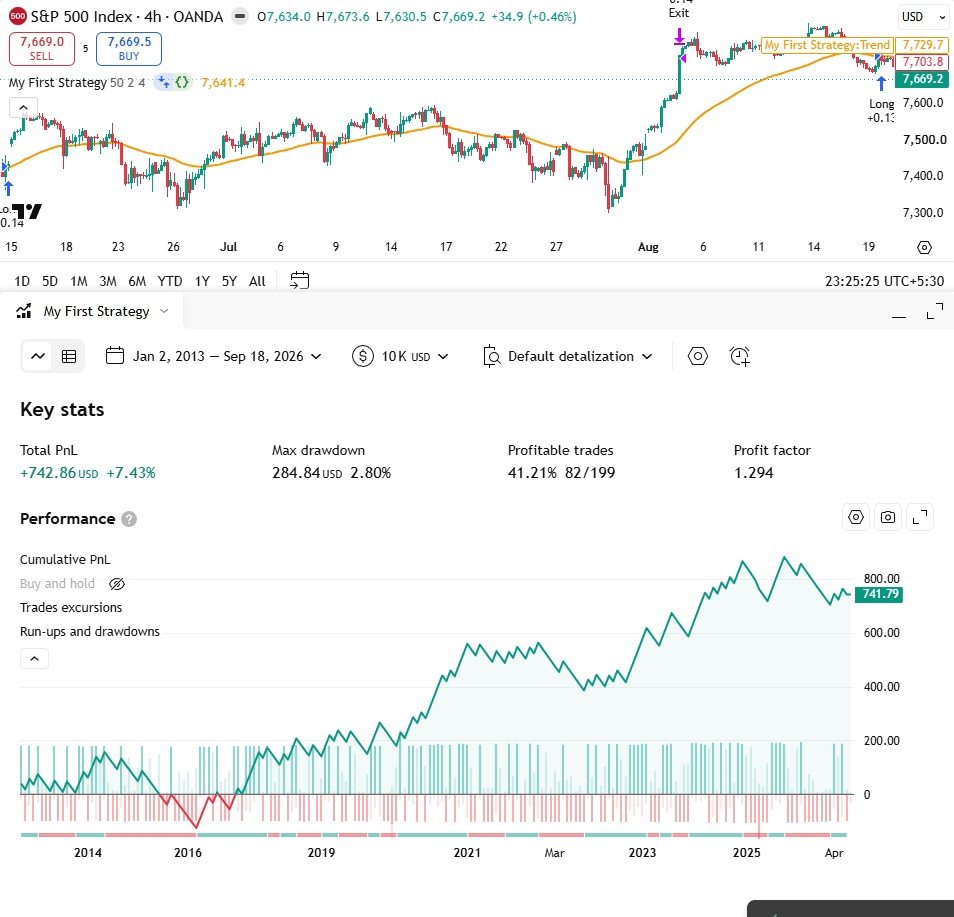
My First Strategy
A beginner strategy for learning the Strategy Tester: buy when price closes back above a trend average, then a 2% stop loss and a 4% take profit. Commission and slippage are included, so the back test is honest.
View code & snapshots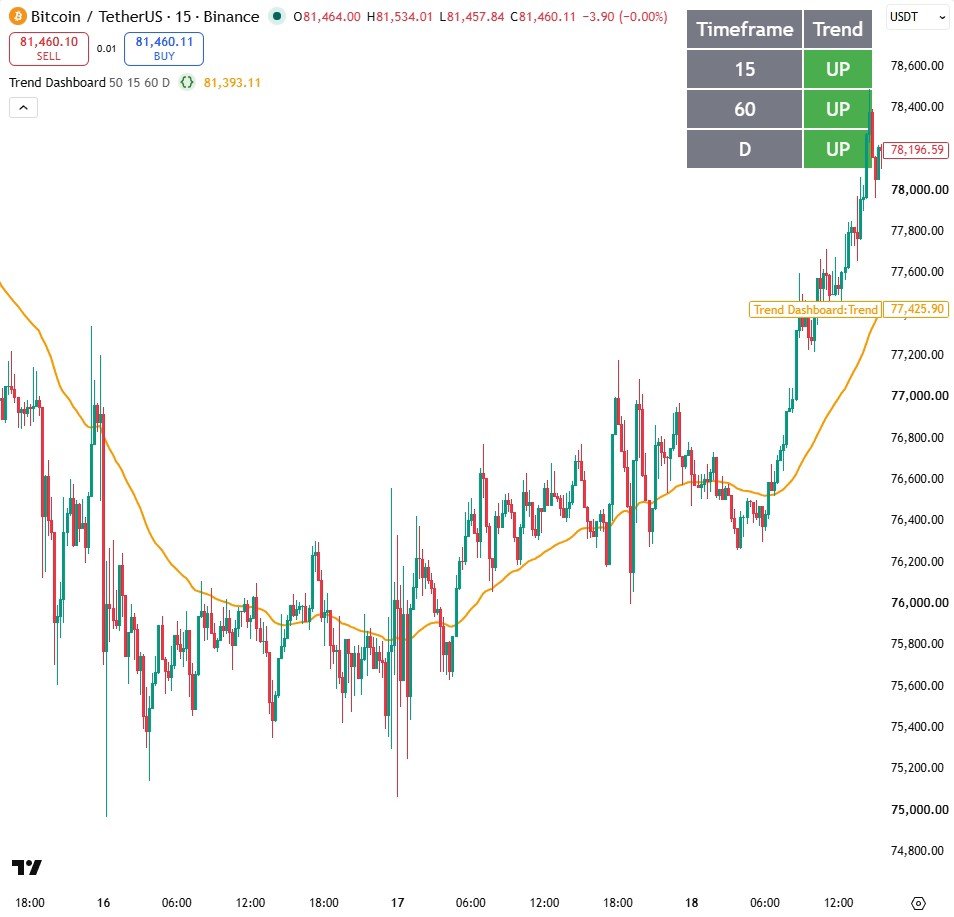
Trend Dashboard
A small table in the corner of the chart showing whether price is above or below its trend average on three timeframes at once. Every timeframe is a setting, so you can match it to how you trade.
View code & snapshots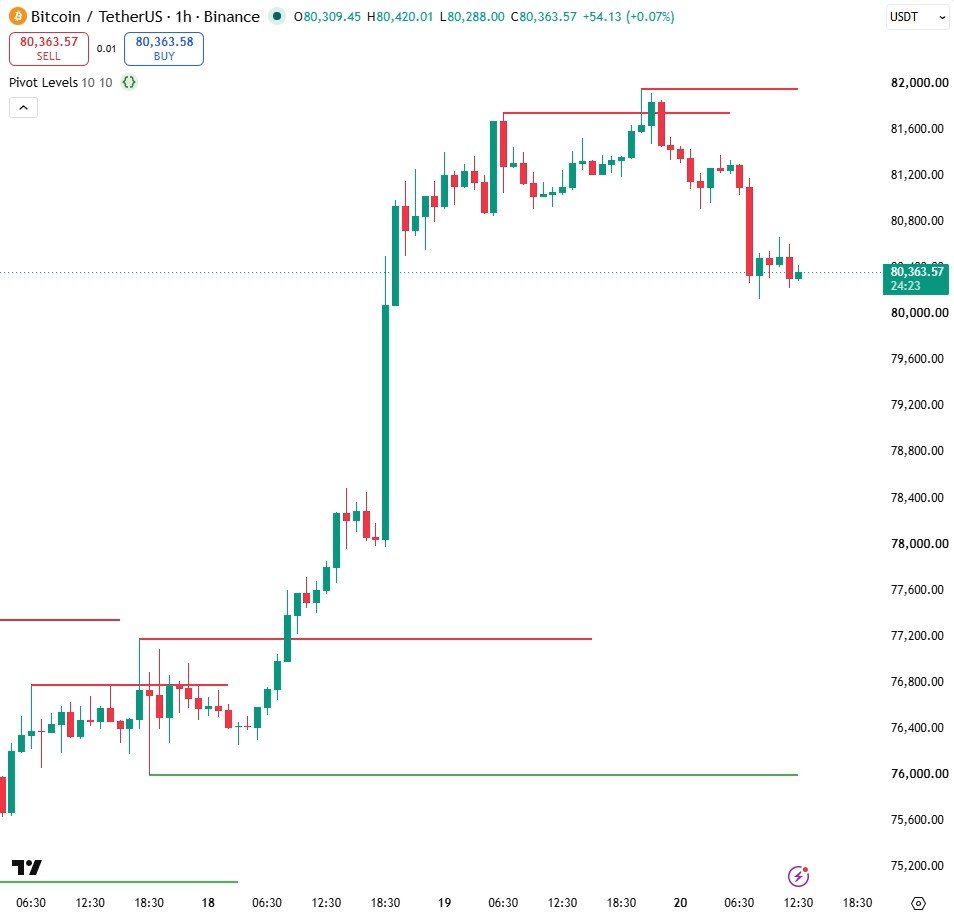
Pivot Levels
Support and resistance drawn by the code: it finds pivot highs and lows, draws each level as a line that stretches forward with price, and alerts you when the newest level breaks.
View code & snapshots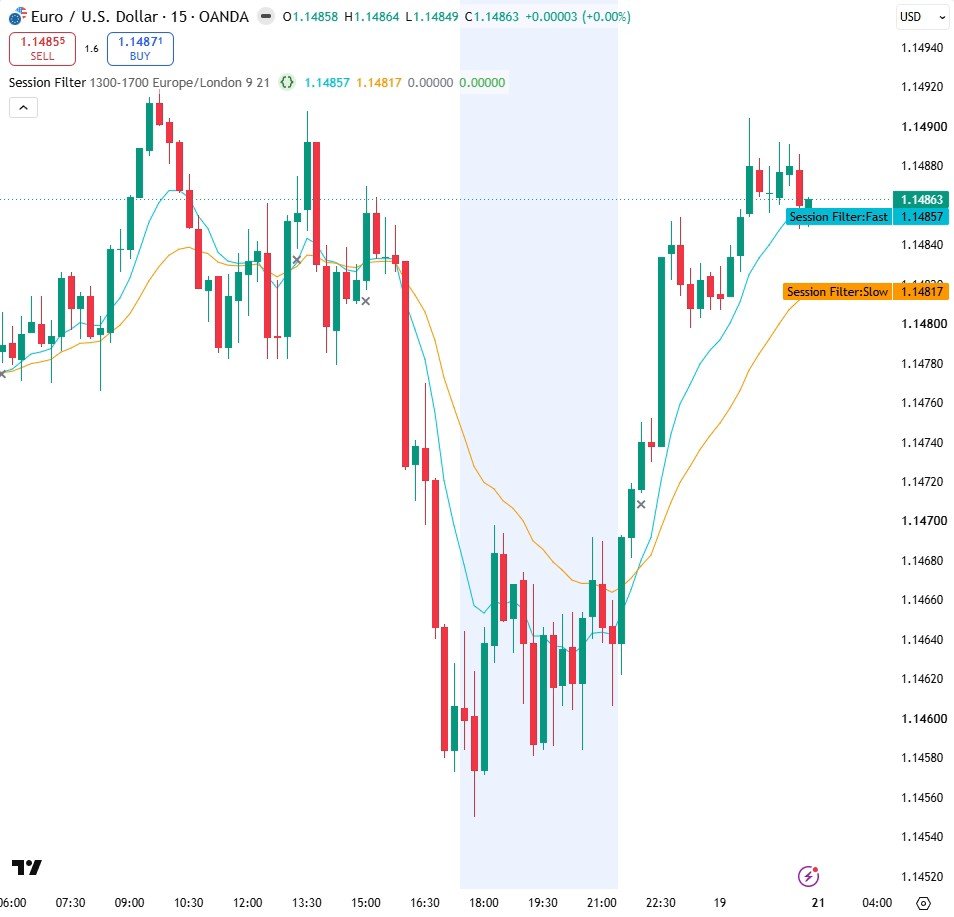
Session Filter
Shades your trading hours on the chart and keeps signals only inside them. Every signal the filter removed is marked with a grey cross, so you can see exactly what it cost you.
View code & snapshots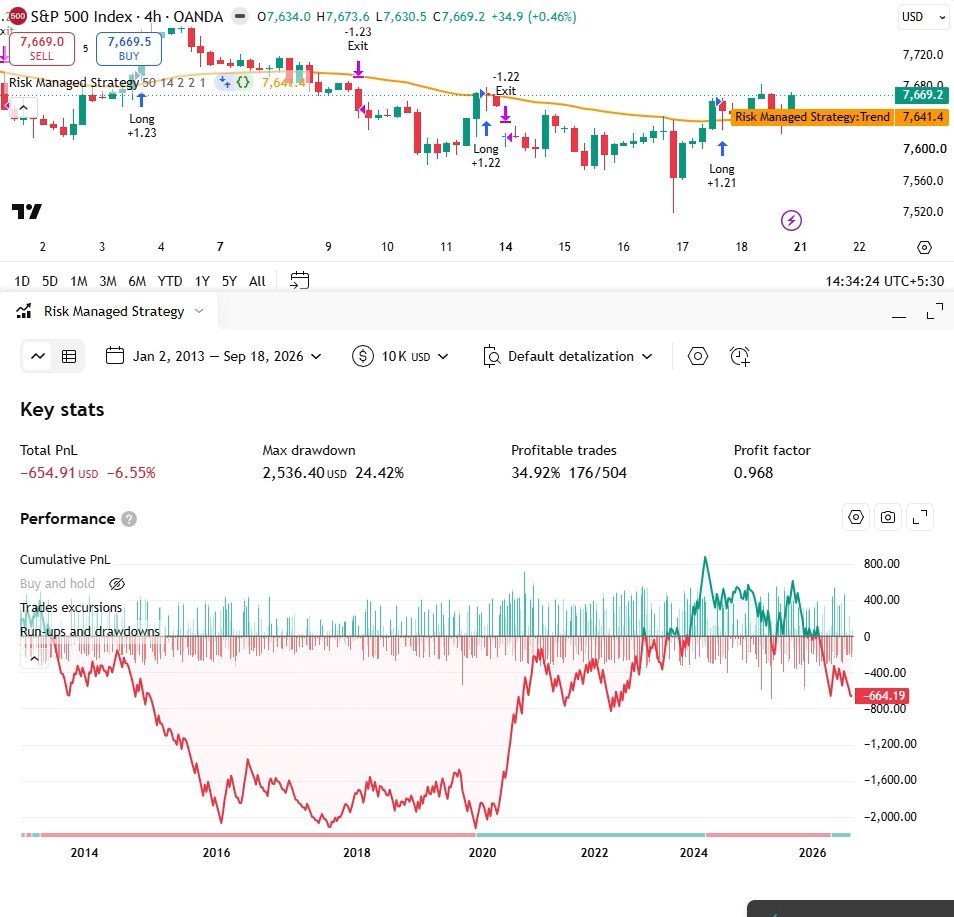
Risk Managed Strategy
An ATR stop and a position size calculated from the risk you choose, so every loss costs the same. The back test result is honestly negative, and the lesson explains exactly why.
View code & snapshots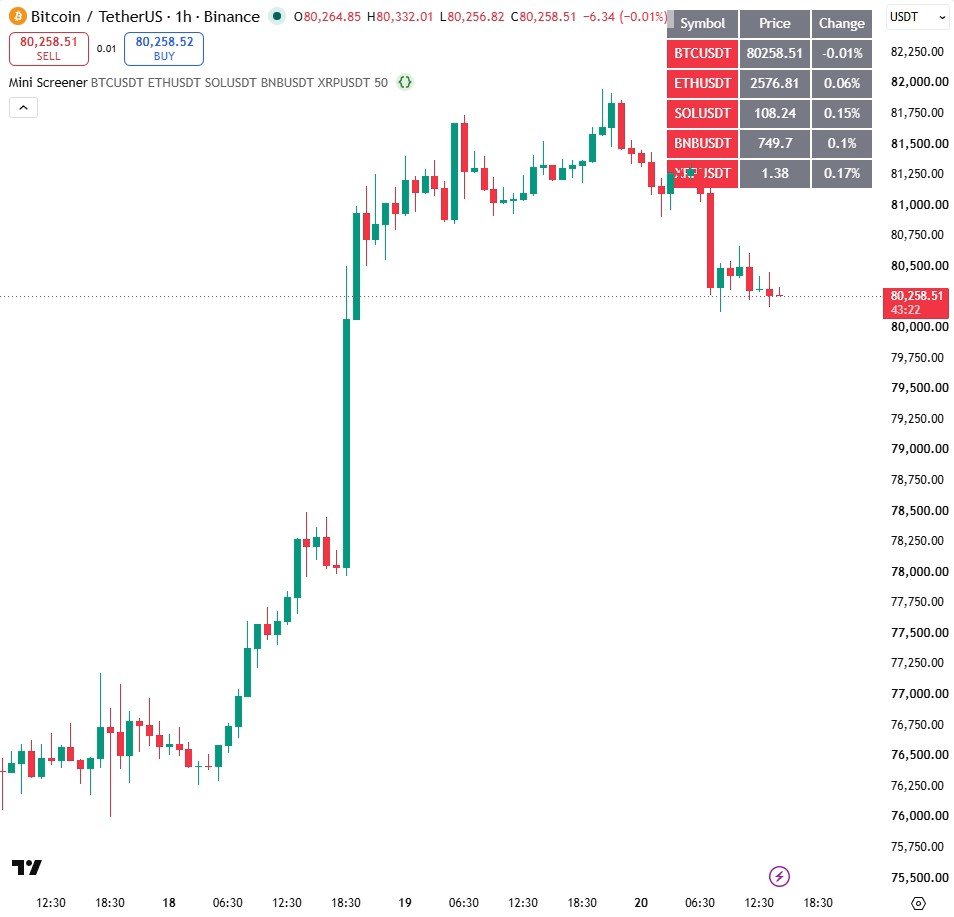
Mini Screener
One table on one chart that watches five markets at once: price, change since the last candle, and whether each one is above its trend average. Built with arrays and a loop.
View code & snapshots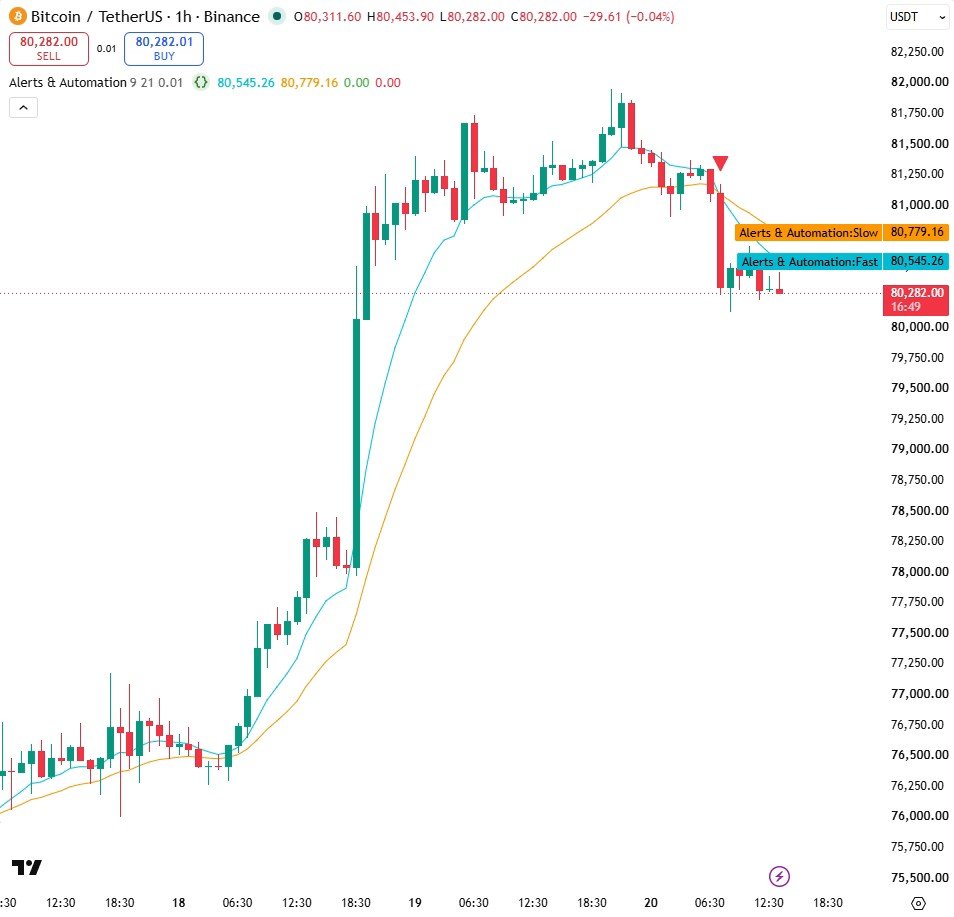
Alerts & Automation
Both ways Pine Script raises an alert, side by side: a readable message for your phone, and a JSON message for a webhook, which is the first real step towards automated trading.
View code & snapshots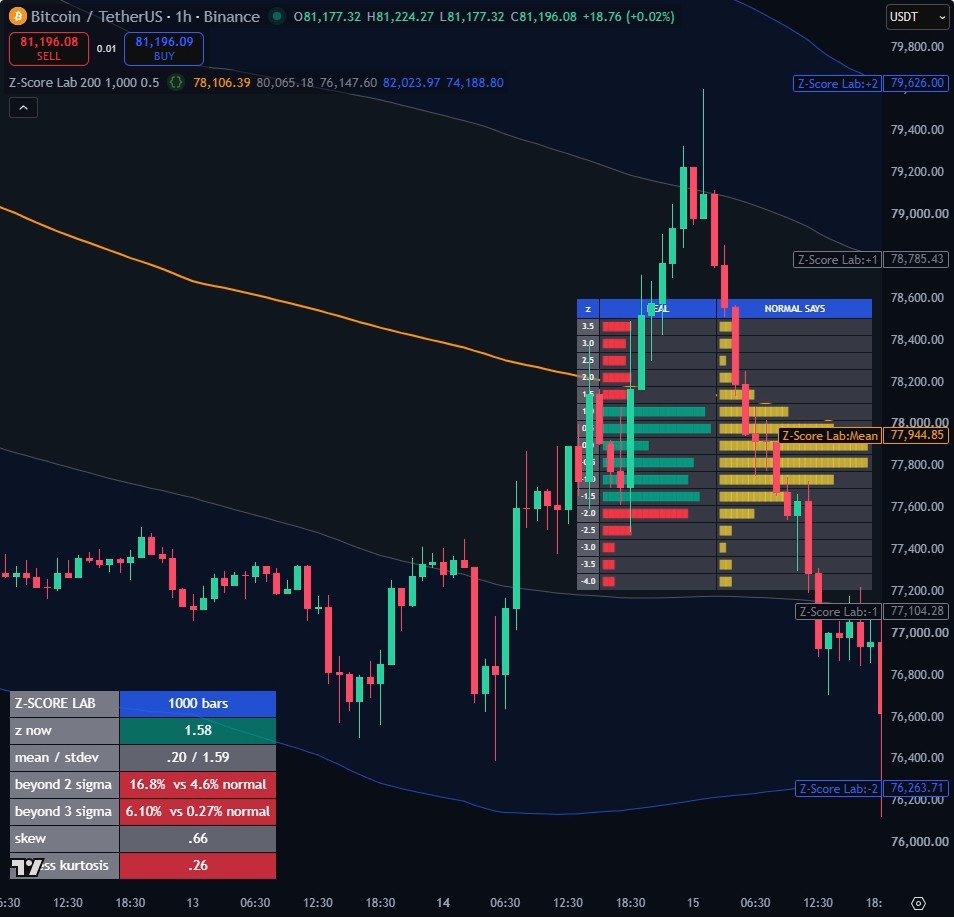
Z-Score Lab
Standard deviation bands drawn on price, with a live table that counts how often price actually left them and compares that with what a normal distribution predicts. On crypto the 2-sigma band is breached about three times more often than the textbook says.
View code & snapshots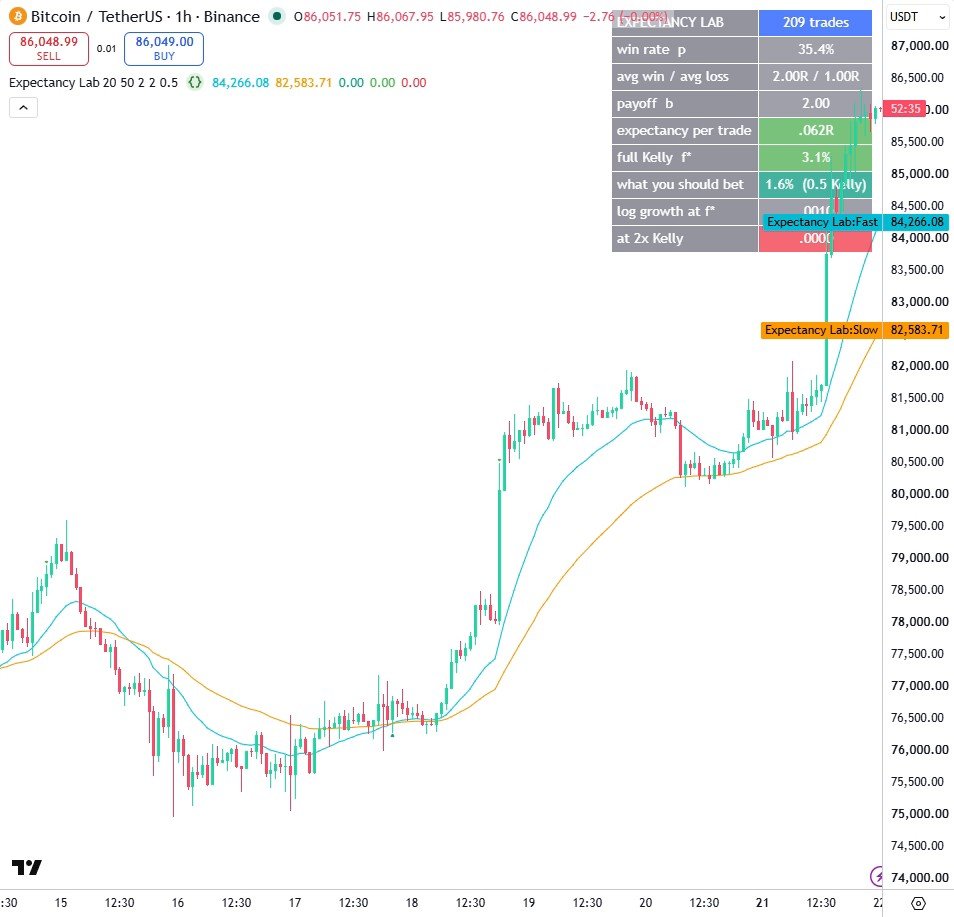
Expectancy & Kelly Lab
A deliberately simple moving-average signal that keeps its own trade list, then measures its expectancy in R, the full Kelly fraction implied by its own win rate and payoff, and the growth rate you would get at Kelly and at twice Kelly.
View code & snapshots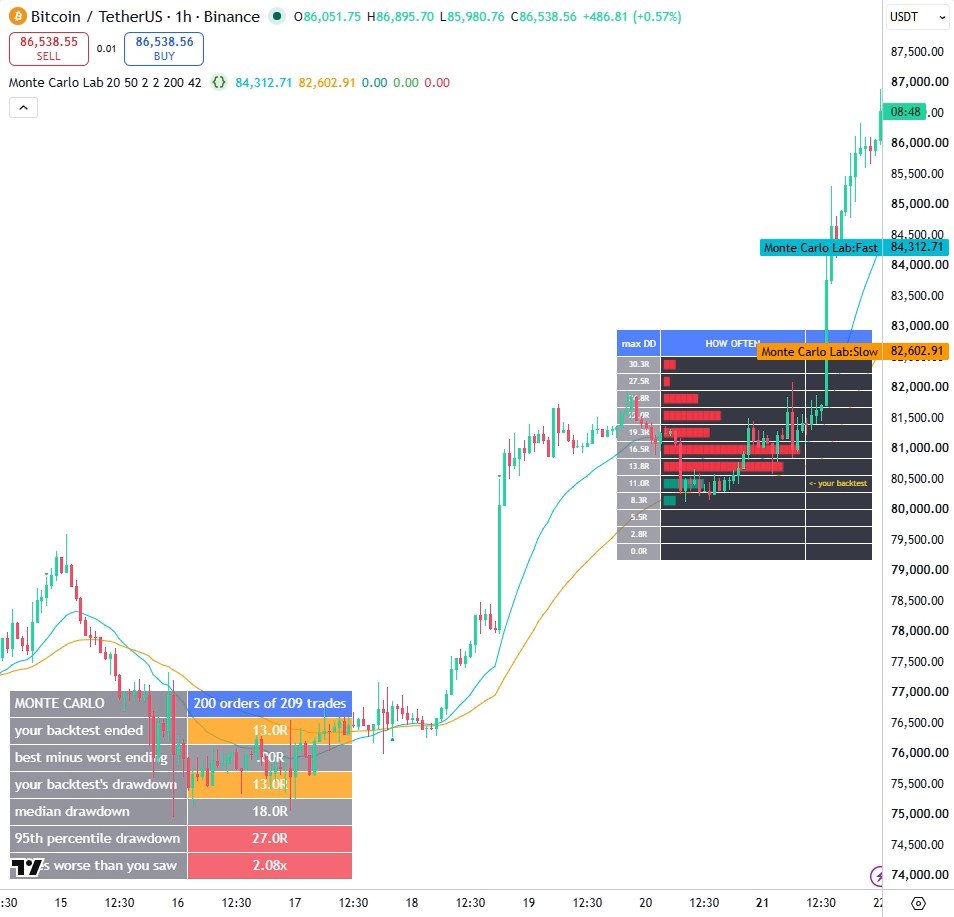
Monte Carlo Lab
Your backtest is one ordering of your trades, not the only one it could have had. This shuffles the same closed trades into two hundred alternative histories and shows where the real backtest sits among them.
View code & snapshots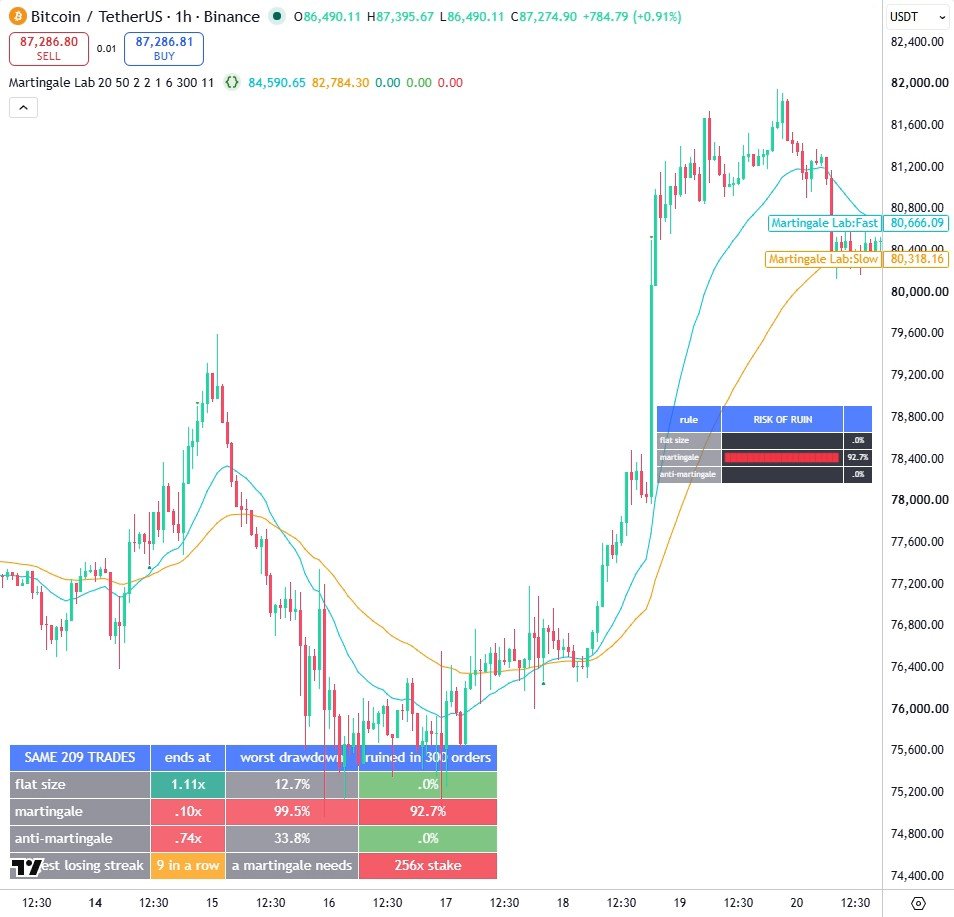
Martingale Lab
Doubling after a loss tested honestly. The same 209 trades are re-run under flat sizing, martingale and anti-martingale, across three hundred orderings, and the ruin rate is counted rather than argued about.
View code & snapshots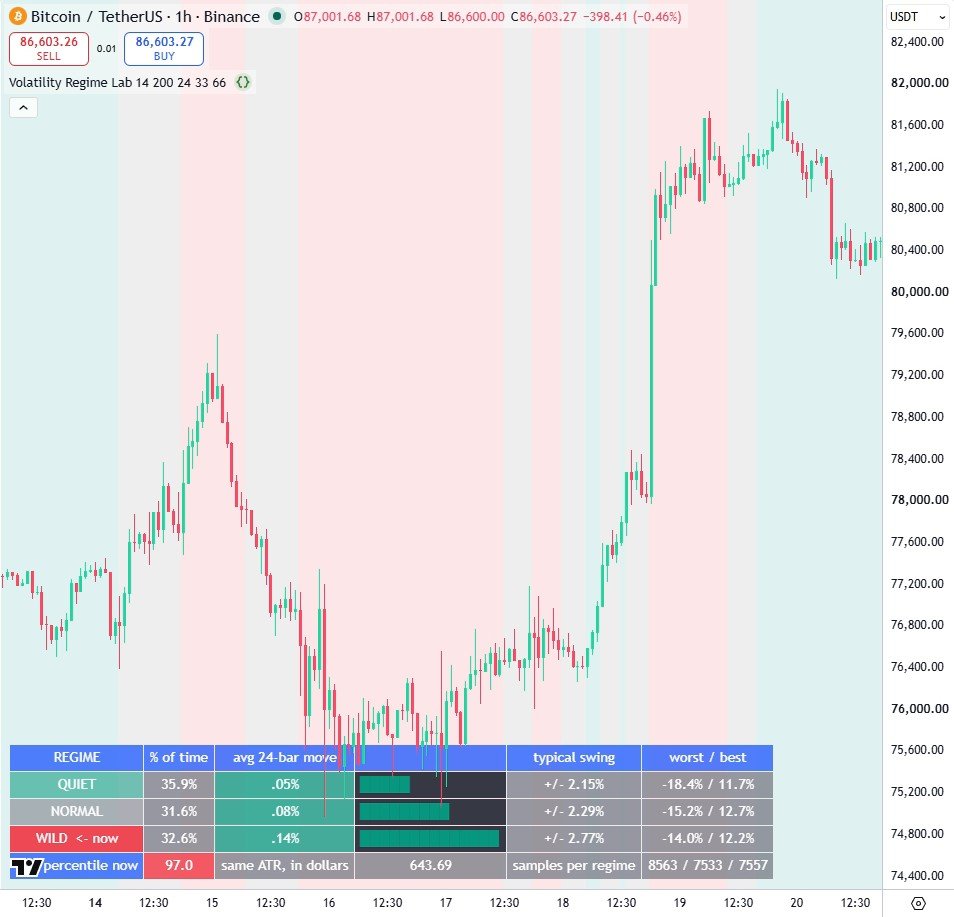
Volatility Regime Lab
ATR in dollars tells you nothing on its own. This ranks today's ATR against its own recent history, splits the chart into quiet, normal and wild regimes, and measures the forward return that followed each one.
View code & snapshots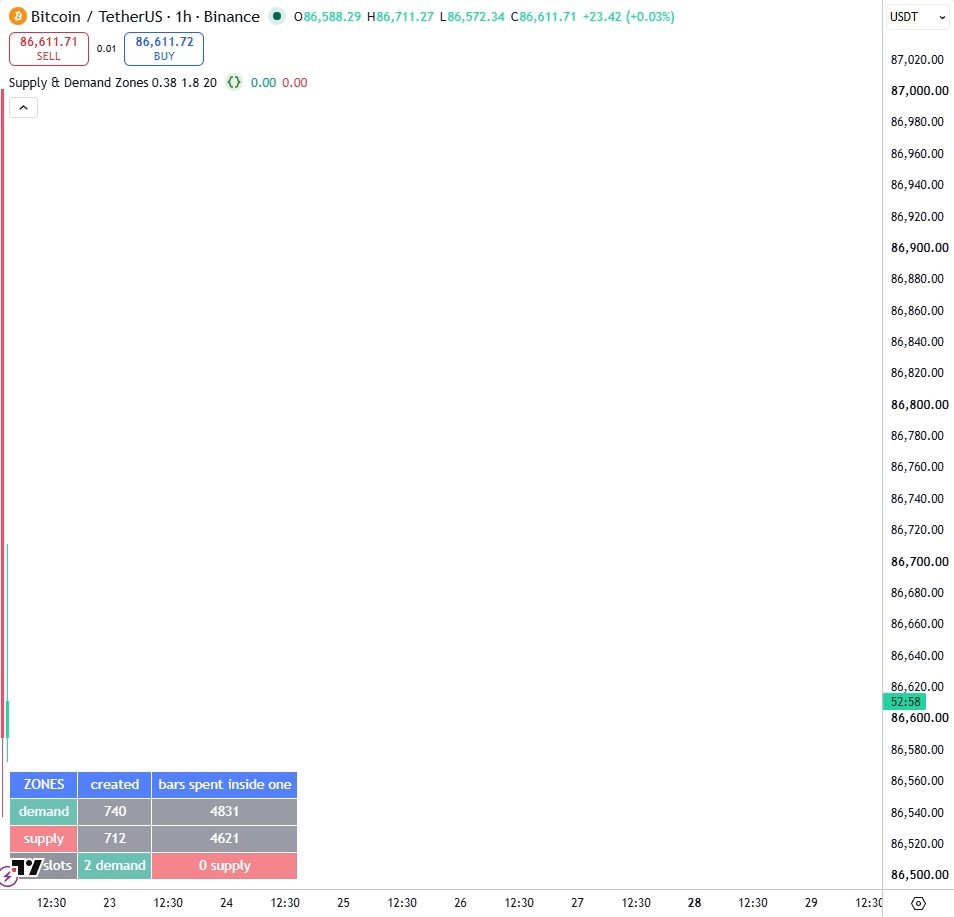
Supply & Demand Zones
What the paid zone indicators are actually doing, written out in arithmetic: a small-bodied base candle, then an impulse candle that runs away from it, leaves a zone behind.
View code & snapshots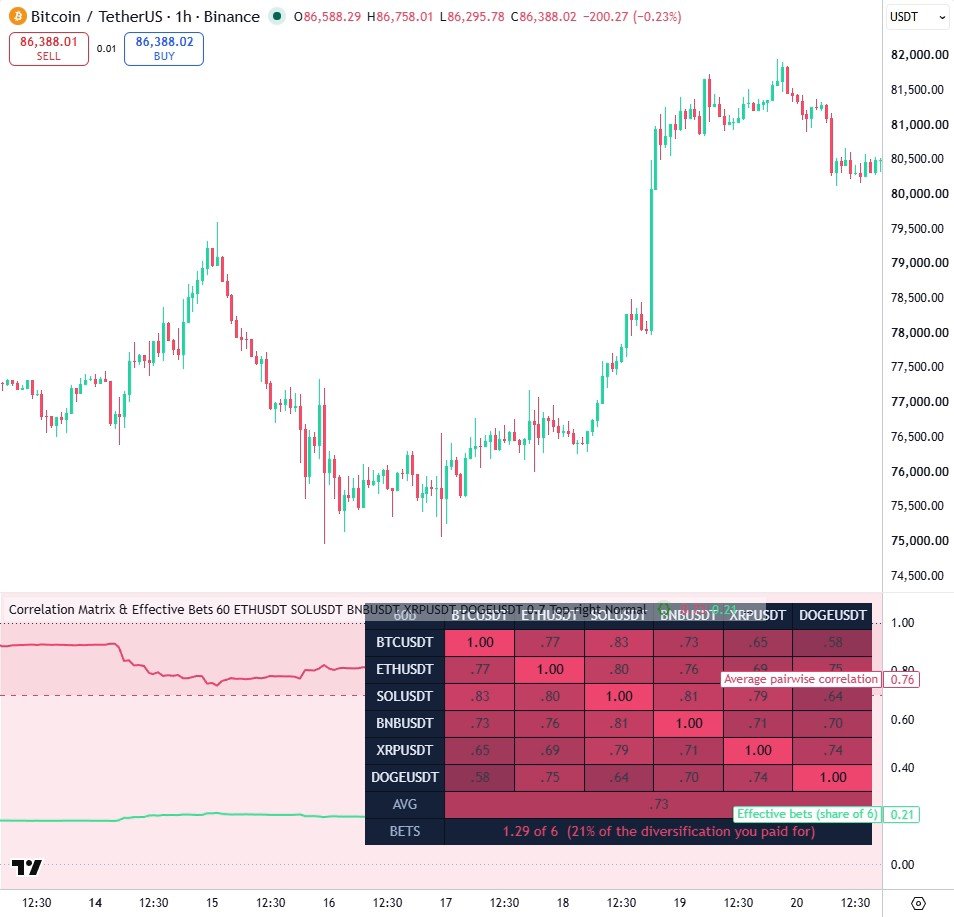
Correlation Matrix & Effective Bets
Six symbols, every pairwise correlation, and the number that matters: how many genuinely independent positions your basket actually contains.
View code & snapshots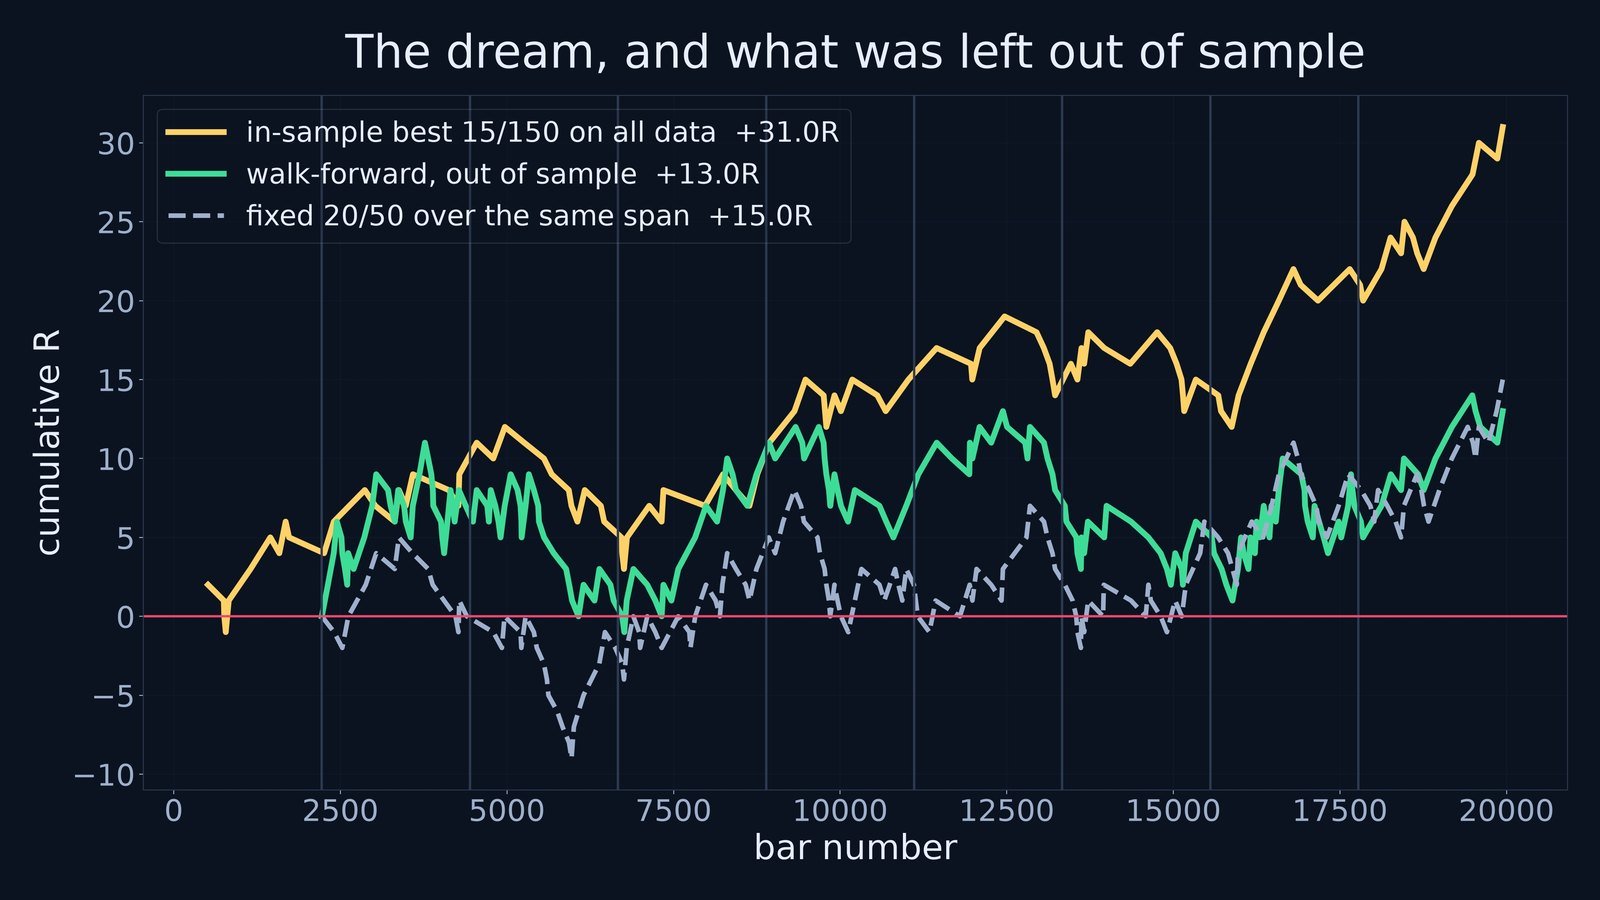
Walk-Forward Lab
Overfitting shown rather than warned about: 154 parameter settings over 20,000 hourly candles, the in-sample best compared with an eight-fold walk-forward and with one fixed setting that was never re-optimised.
View code & snapshots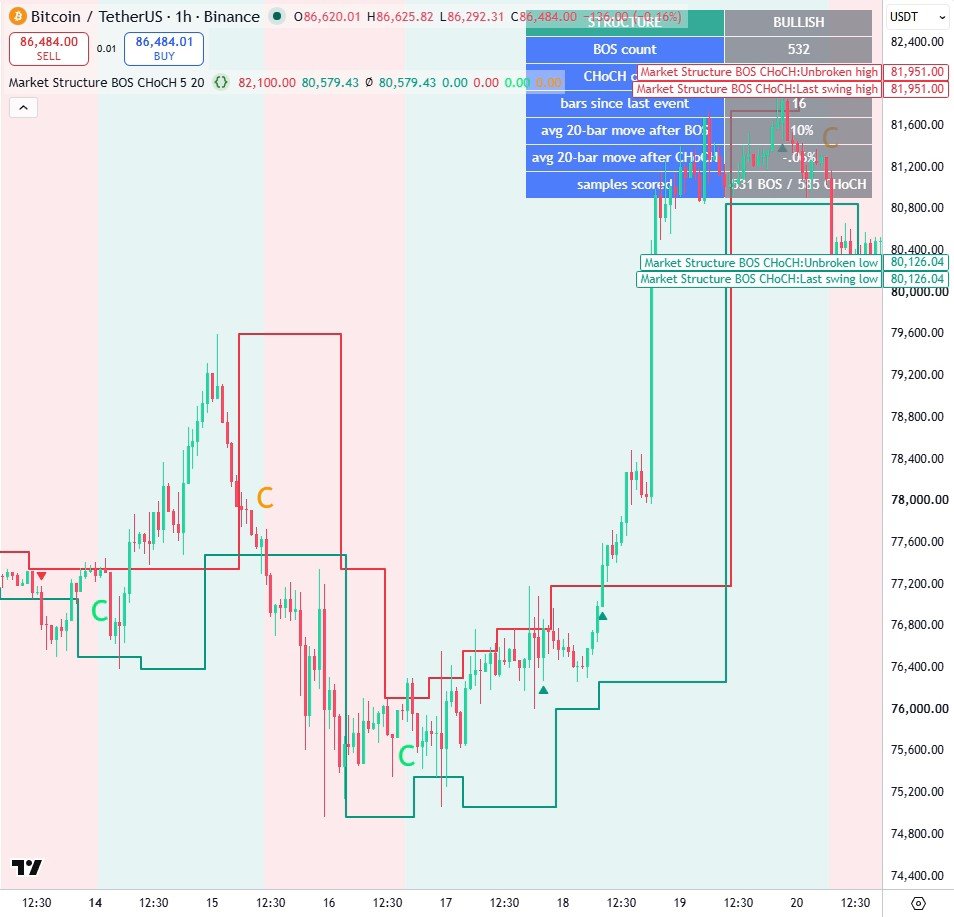
Market Structure: BOS & CHoCH
Break of structure and change of character defined precisely enough to count, then scored: what price actually did in the twenty bars after each signal.
View code & snapshots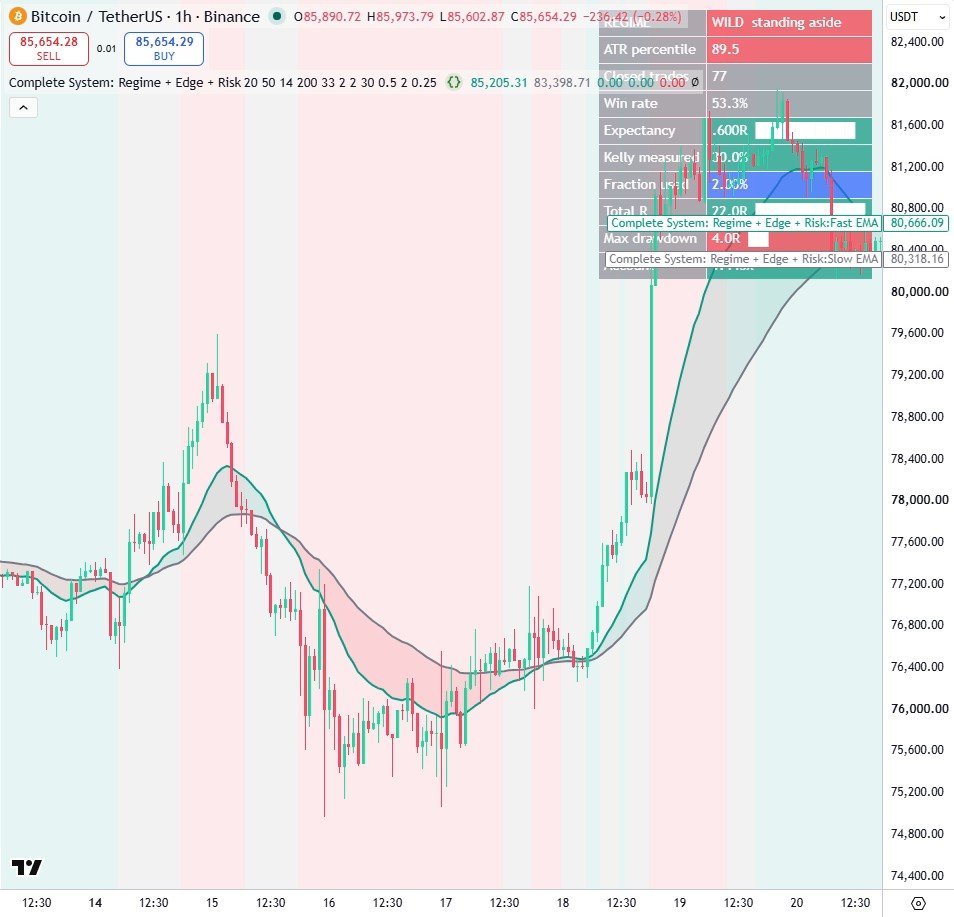
Complete System: Regime + Edge + Risk
The finale of the advanced arc: a regime gate that decides IF we trade, a moving-average edge that decides WHERE, and a Kelly fraction measured from the strategy's own closed trades that decides HOW BIG.
View code & snapshots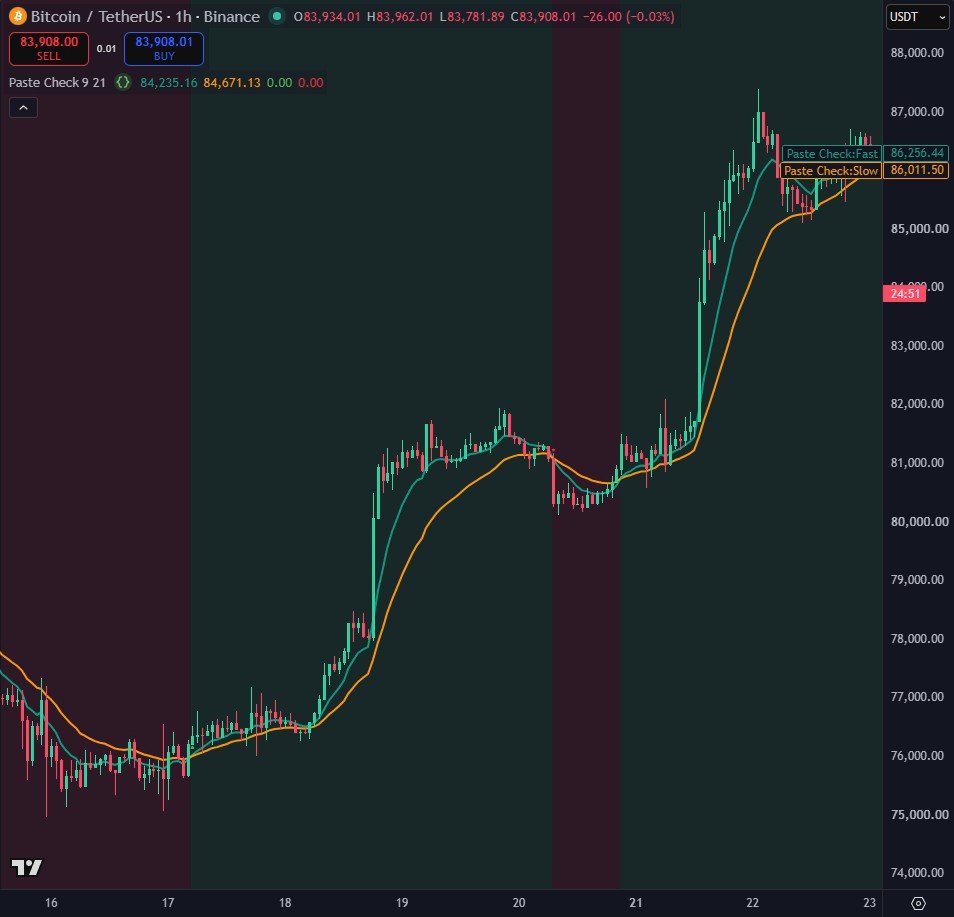
Paste Check (EMA Cross Starter)
The clean script from the beginner guide on adding any Pine Script to TradingView: paste it with Ctrl+A then Ctrl+V over a new indicator, press Add to chart, and it should compile with no red and no yellow. If it does not, the video walks through the 15 paste problems that break it.
View code & snapshots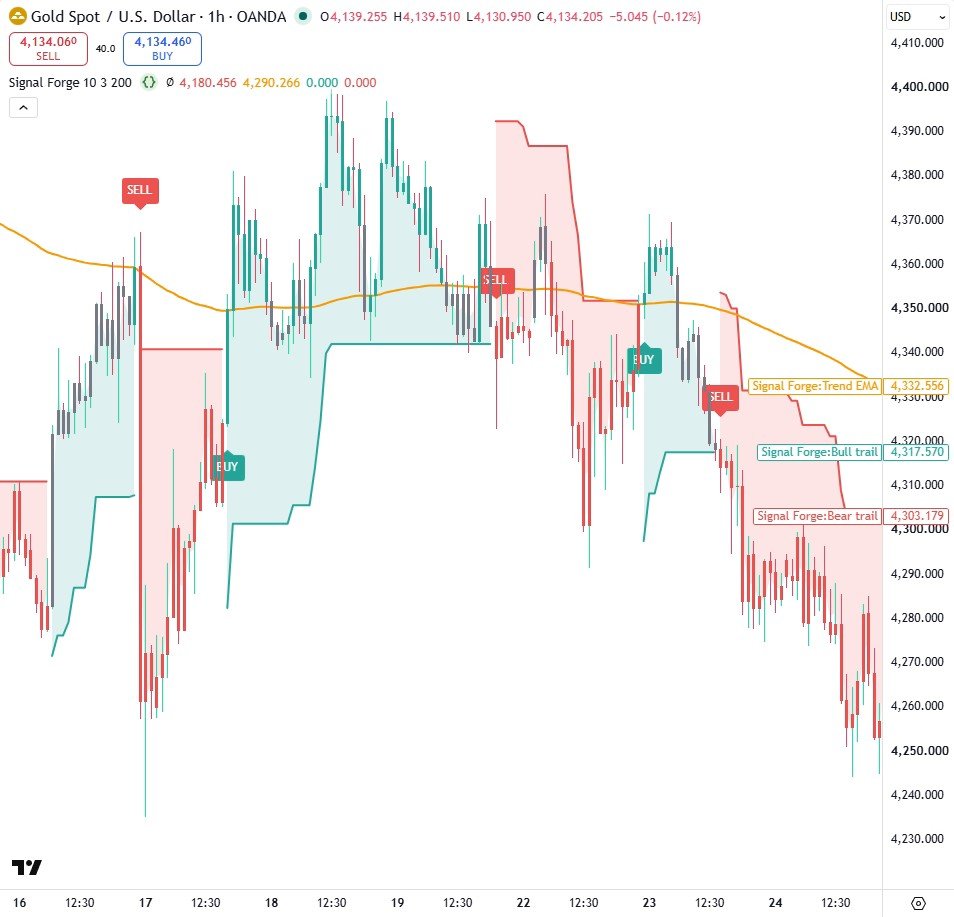
Signal Forge, Part 1 (Core Buy/Sell Engine)
Part 1 of the Signal Forge series: a buy and sell indicator written from a blank editor. An ATR trailing line decides the trend, a 200 EMA referees it, and BUY or SELL only prints on a closed candle, so a signal can never appear and then vanish.
View code & snapshots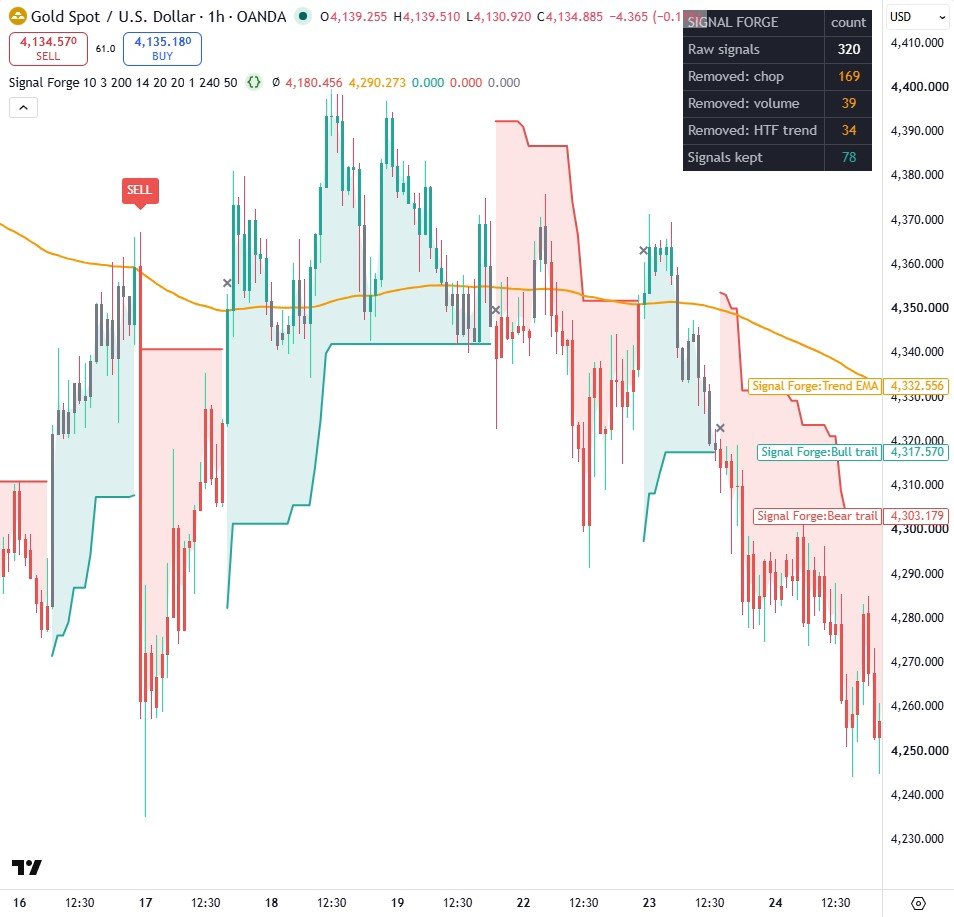
Signal Forge, Part 2 (Fake Signal Filters)
Part 2 of the Signal Forge series adds three filters that kill fake signals: a chop filter built on ADX, a volume filter, and a higher timeframe trend filter that cannot repaint. A scoreboard counts how many raw signals each filter removed.
View code & snapshots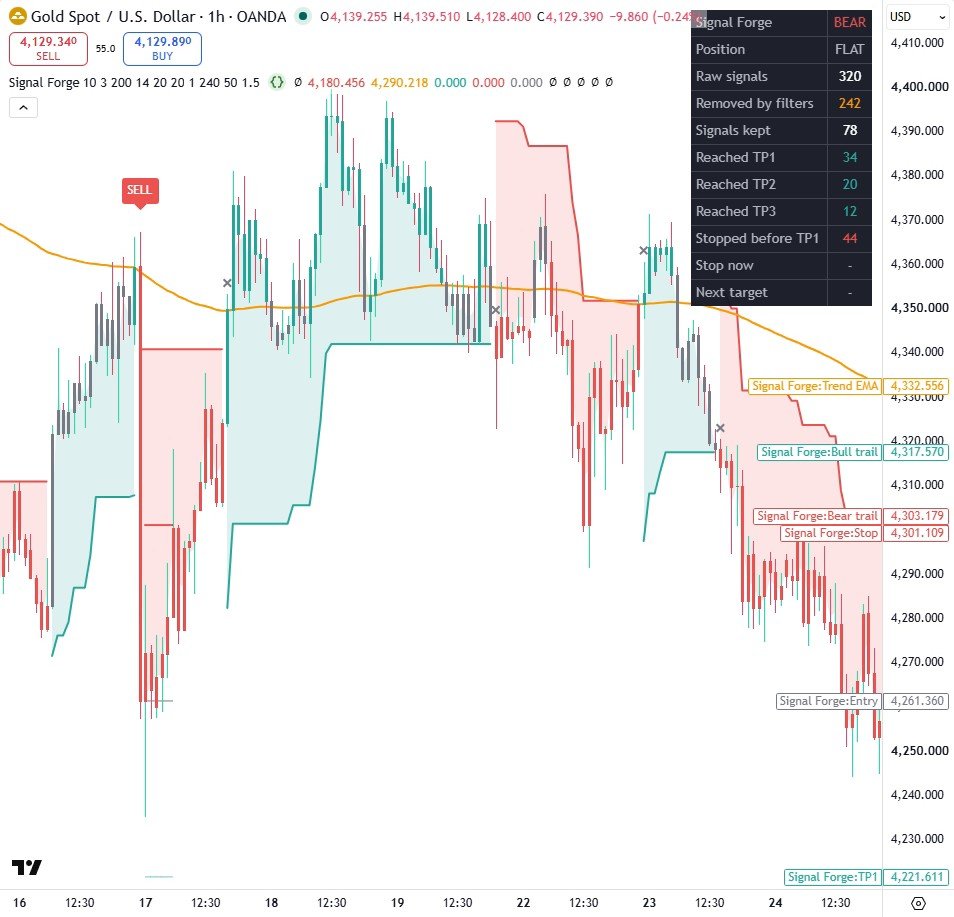
Signal Forge, Part 3 (Stop, Targets, Dashboard)
The finished Signal Forge: every filtered signal gets an ATR stop and three take profit levels drawn on the chart, a trade tracker counts on history how many signals reached each target or were stopped first, and one JSON alert fires on closed candles for bots and webhooks.
View code & snapshots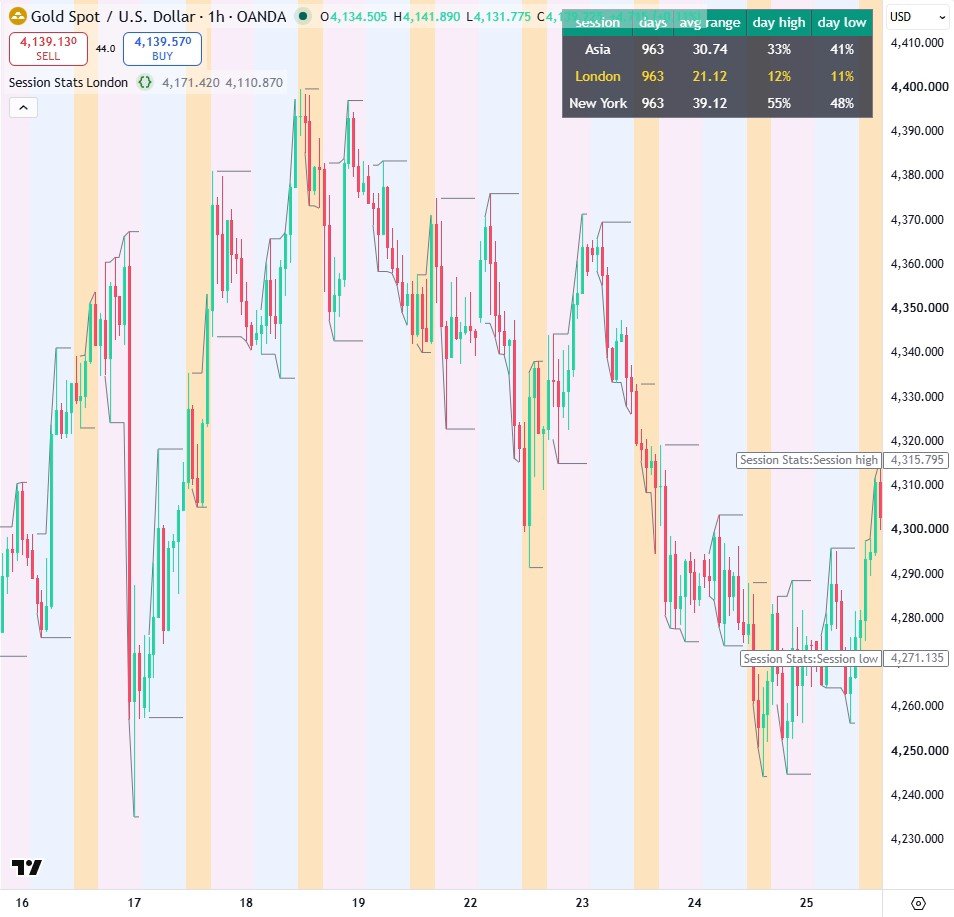
Session Stats (Enums, Methods and Maps)
Lesson 25 of the Pine Script course. An enum of trading sessions, a user-defined type with methods, and a map keyed by the enum measure which session makes gold's high and low of the day, with the average range of each session.
View code & snapshots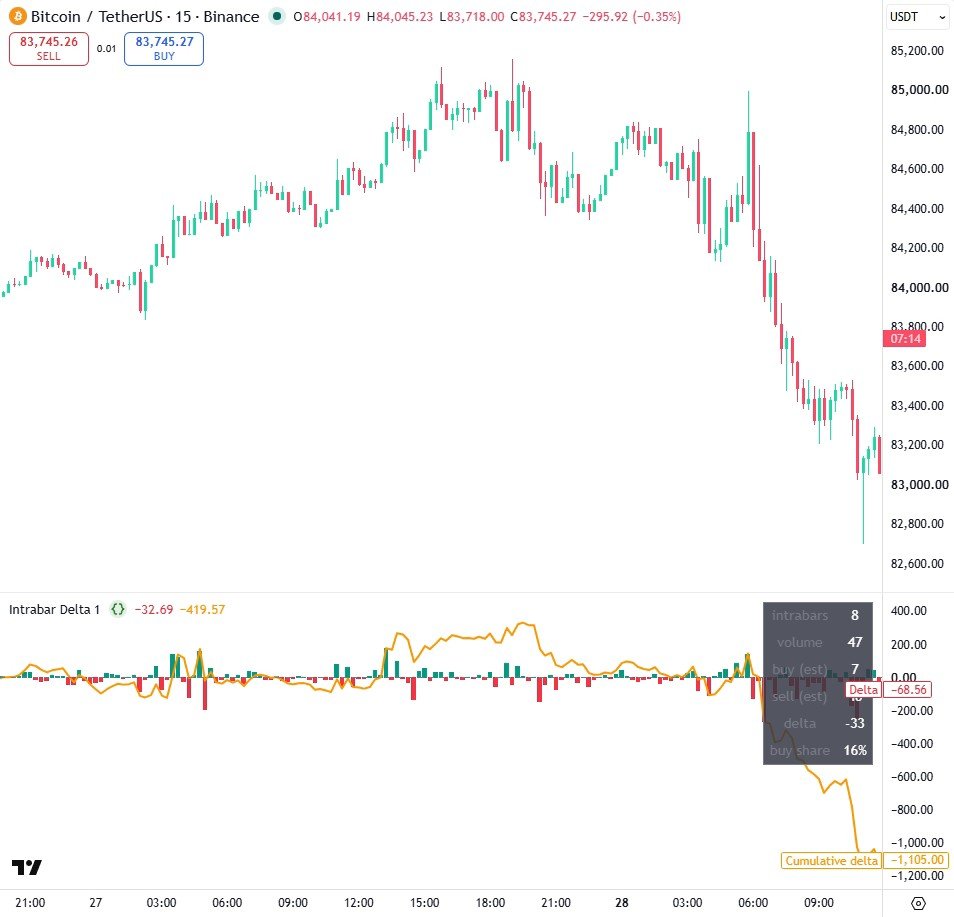
Intrabar Delta (request.security_lower_tf)
Lesson 26 of the Pine Script course. request.security_lower_tf returns the 1 minute candles inside every chart candle as arrays, and the script uses them to estimate buying and selling volume, plot delta as columns and keep a cumulative delta that resets each day.
View code & snapshots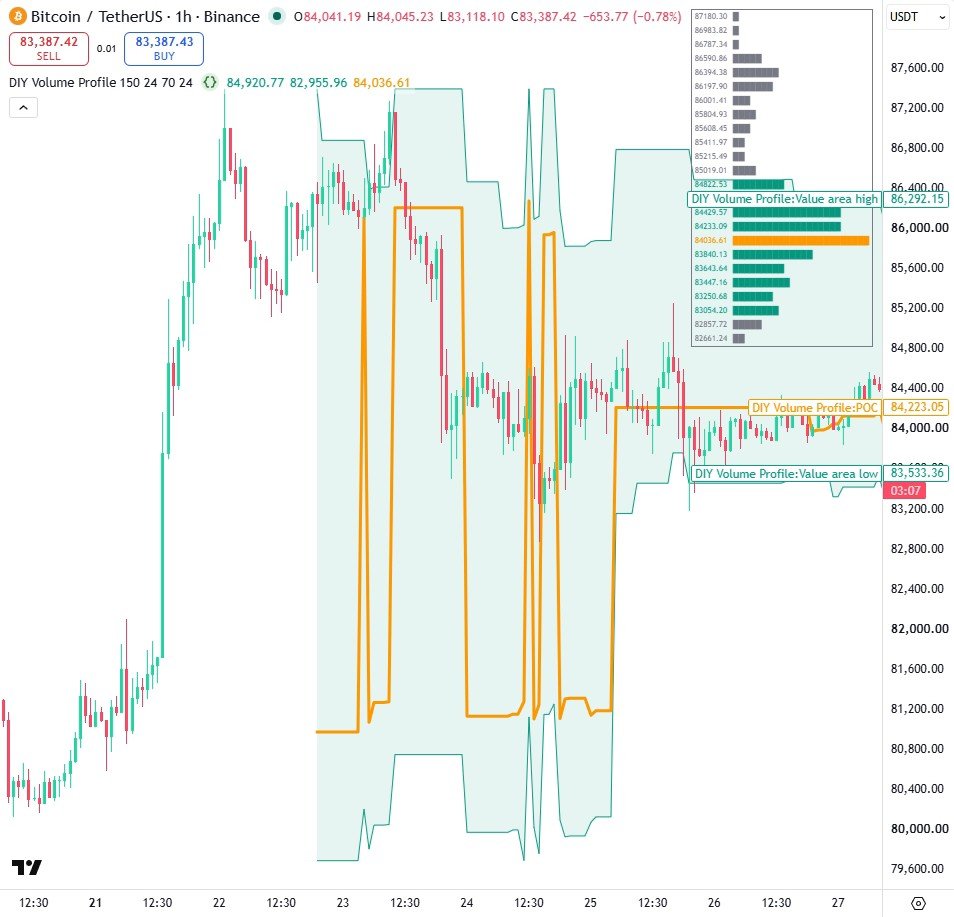
DIY Volume Profile (POC and Value Area)
Lesson 27 of the Pine Script course. A volume profile built from scratch with arrays: every candle's volume is spread across the price rows it covers, the point of control is the busiest row, and the 70% value area grows outwards from it. The histogram is drawn as a table of block characters.
View code & snapshots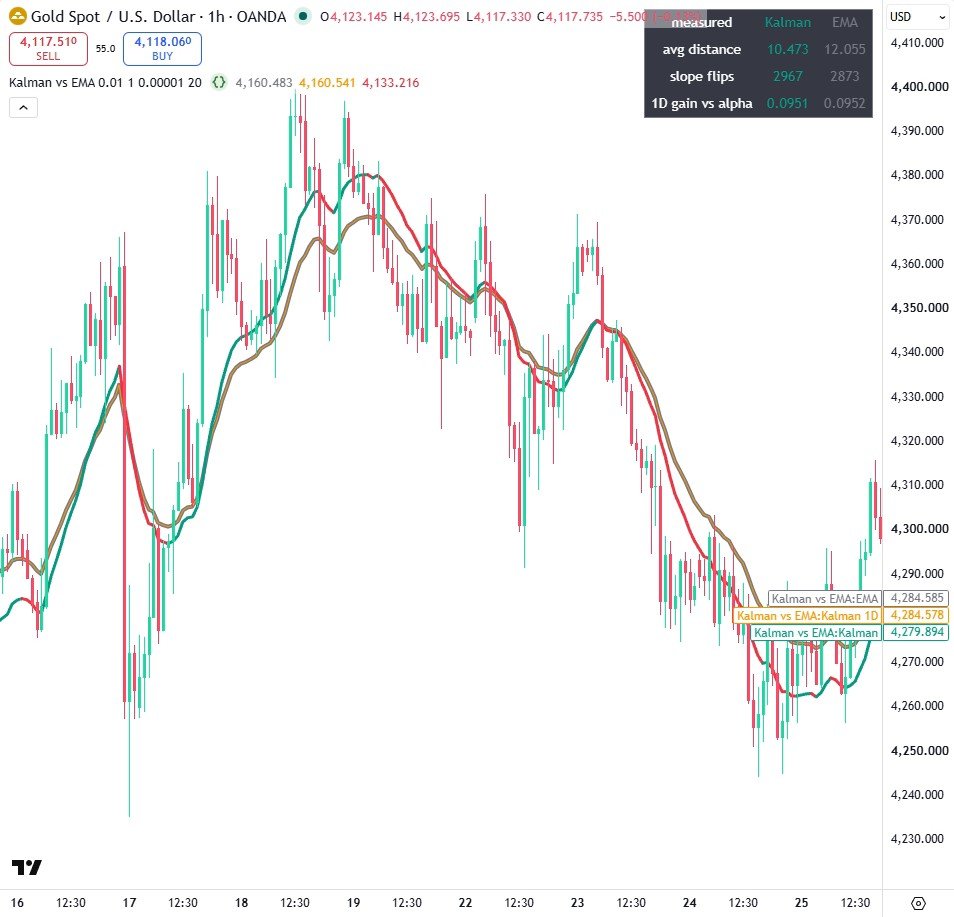
Kalman vs EMA
Lesson 28 of the Pine Script course. A Kalman filter written with var state: the 1-D version with fixed noise settles into an EMA, and the price plus velocity version is compared against an EMA on the same chart with a table that measures distance to price and slope flips.
View code & snapshots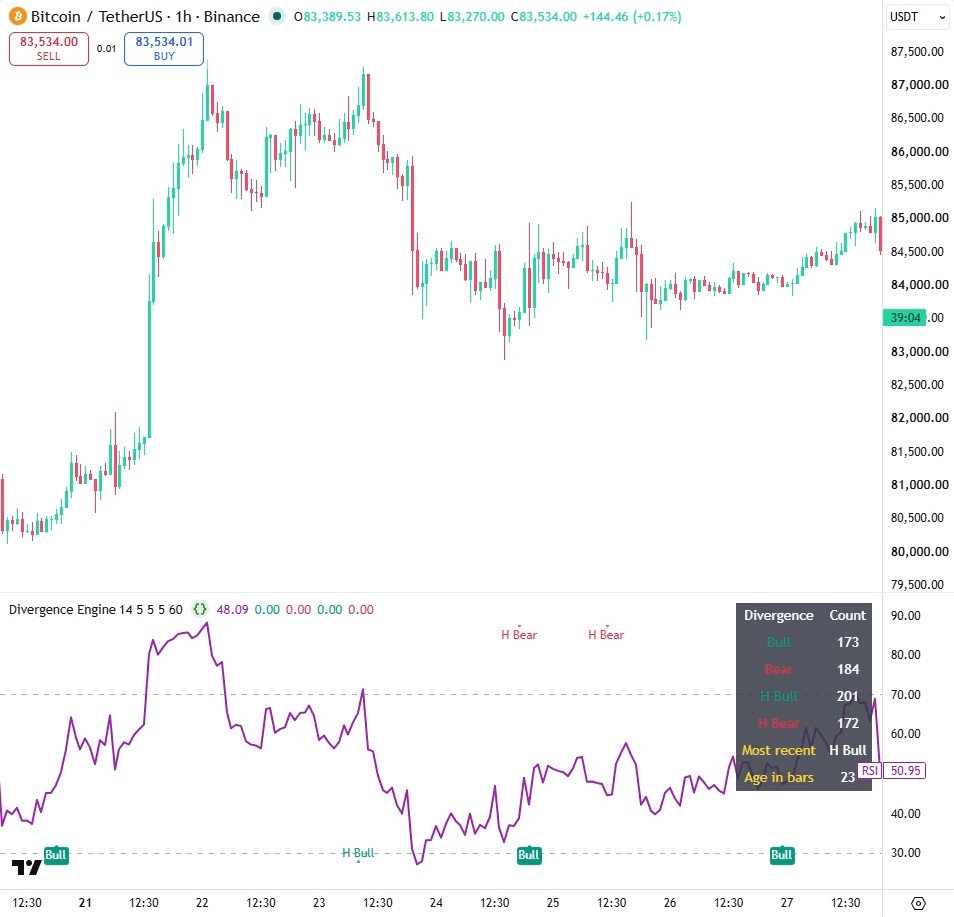
Divergence Engine (RSI Divergences)
Lesson 29 of the Pine Script course. RSI pivots are stored as a user-defined type in arrays and compared with the price at the same candle to detect regular and hidden bullish and bearish divergences, marked where they are confirmed rather than moved back in time.
View code & snapshots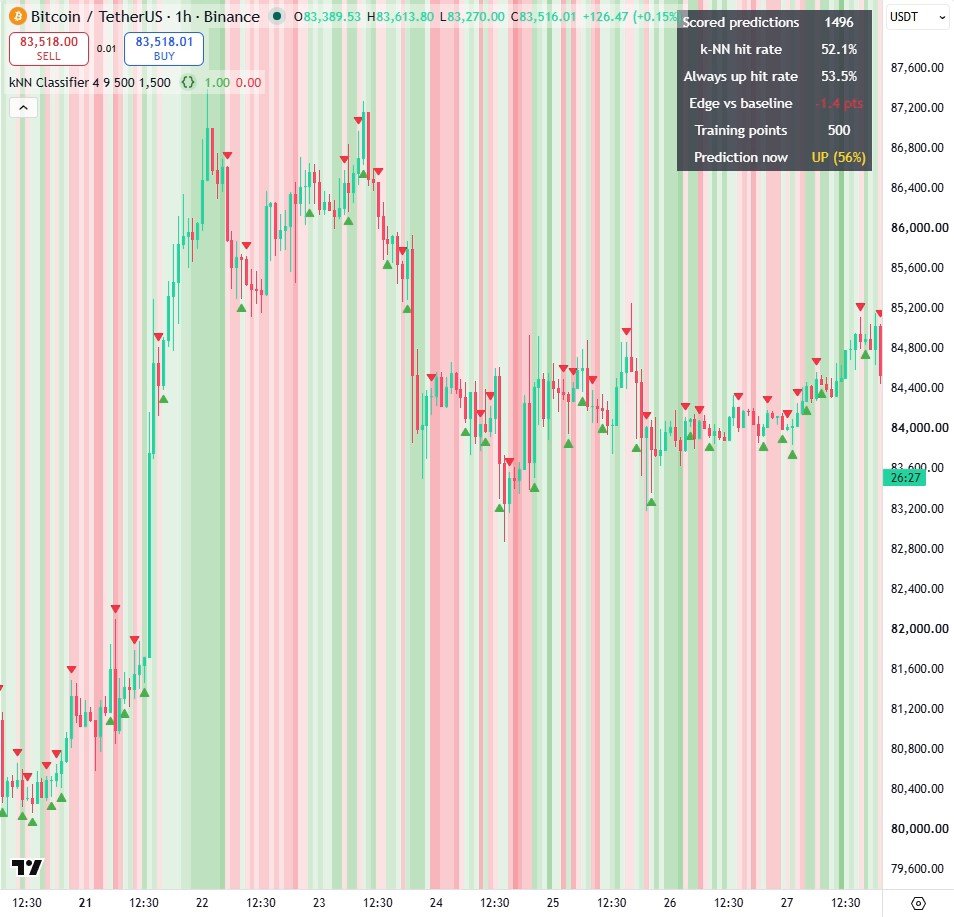
kNN Classifier (Machine Learning in Pine)
Lesson 30 of the Pine Script course. A k nearest neighbours classifier in Pine: three scaled features, labels that only become known after the forecast horizon so nothing looks ahead, and a table that scores every prediction against an always-up baseline on the same bars.
View code & snapshotsWatch: Pine Script (Lesson 30): I Taught TradingView To Predict The Next Candle
Watch: Pine Script (Lesson 29): Your Divergence Indicator Is Lying About One Thing
Watch: Pine Script (Lesson 28): The Kalman Filter Is Secretly An EMA
Watch: Pine Script (Lesson 27): Every Paid Volume Profile Does This One Thing
Watch: Pine Script (Lesson 26): A Green Candle Can Be Mostly Selling
Watch: Pine Script (Lesson 25): Which Session Makes Gold's High Of The Day?
Watch: I Made My Buy Sell Indicator Count Its Own Wins And Losses (TradingView)
Watch: How To Kill Fake Buy Sell Signals On TradingView (3 Filters, Free Code)
Watch: I Built The BEST Buy Sell Indicator On TradingView (Free, No Repaint)
Watch: How To Add Any Pine Script To TradingView (15 Paste Errors Fixed)
Watch: Pine Script (Lesson 21): Regime + Edge + Risk, The Complete System
Watch: Pine Script (Lesson 20): Market Structure, BOS and CHoCH Without The Hype
Watch: Pine Script (Lesson 19): Overfitting and Walk-Forward, With Proof
Watch: Pine Script (Lesson 18): Correlation, and Why Your 5 Trades Are 1 Trade
Watch: Pine Script (Lesson 17): How 'Premium' Supply & Demand Indicators Actually Work
Watch: Pine Script (Lesson 16): Trend Following Worked Best in QUIET Markets
Watch: Pine Script (Lesson 15): I Tested Martingale on 5,000 Futures. It Died in 64%.
Watch: Pine Script (Lesson 14): Monte Carlo, Your Backtest Is One Sample
Watch: Pine Script (Lesson 13): Expectancy, Kelly and the Maths of Winning
Watch: Pine Script (Lesson 12): Why Your 2-Sigma Band Keeps Breaking
Watch: Pine Script Course Lesson 11: Multi-Symbol Screener Table
Watch: Pine Script Course Lesson 10: ATR Stops & Position Sizing
Watch: Pine Script Course Lesson 9: Alerts & Webhook Automation
Watch: Pine Script Course Lesson 8: Trade Only In Your Session
Watch: Pine Script Course Lesson 7: Support & Resistance From Pivots
Watch: Pine Script Course Lesson 6: Multi-Timeframe Trend Dashboard
Watch: Pine Script Course Lesson 5: Your First Strategy + Backtest
Watch: Pine Script Course Lesson 4: Engulfing Candles
Watch: Pine Script Course Lesson 3: Previous Day High & Low
Watch: Pine Script Course Lesson 2: Your First Indicator
Watch: Pine Script v6 From Scratch: EMA Trend Signals
Watch: TradingView Masterclass
Need a custom indicator or strategy?
Non-repainting Pine Script v6, backtested with real costs, alert and webhook ready. Fixed quote within 24 hours.