Snapshots
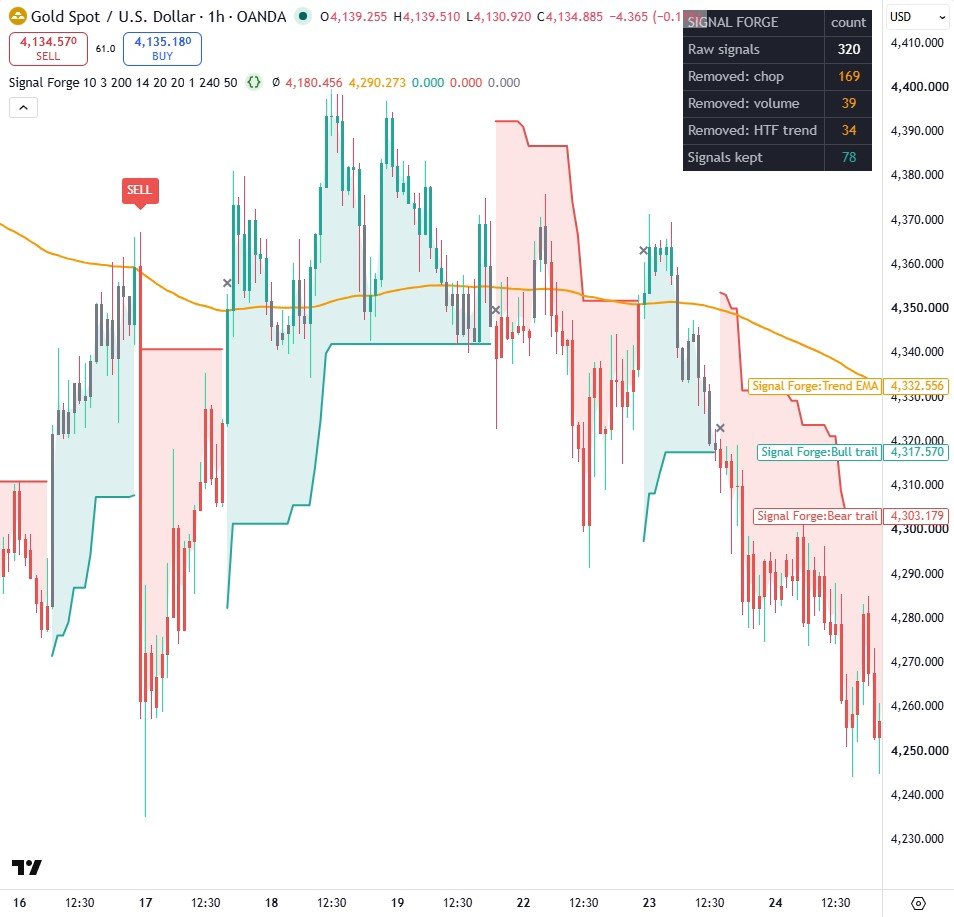
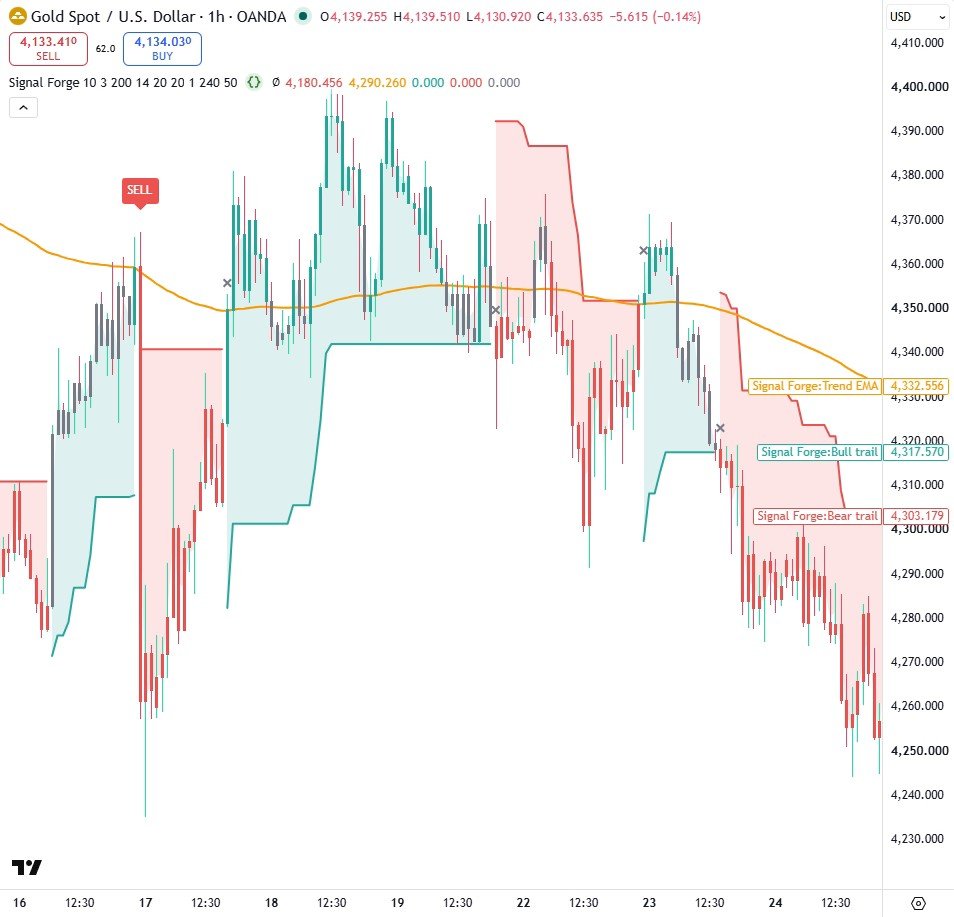
How it works
- Chop filter: a signal needs ADX above a minimum (14 and 20 by default), so sideways markets stay quiet.
- Volume filter: the signal candle's volume must be at least a multiple of its 20 bar average.
- Higher timeframe filter: request.security reads the 4 hour close and EMA with the [1] offset, so it only uses closed higher timeframe candles; every veto is counted on the scoreboard.
Settings
| Setting | Default | What it does |
|---|---|---|
| Chop filter (ADX) | true | Turn the ADX filter on or off |
| ADX length / Minimum ADX | 14 / 20 | How the chop filter measures trend strength |
| Volume filter | true | Turn the volume filter on or off |
| Volume average length / Volume multiple | 20 / 1.0 | Signal volume must beat this average times this multiple |
| Higher timeframe filter | true | Turn the higher timeframe trend filter on or off |
| Higher timeframe / Higher timeframe EMA | 240 / 50 | Which timeframe and EMA define the bigger trend |
Source code
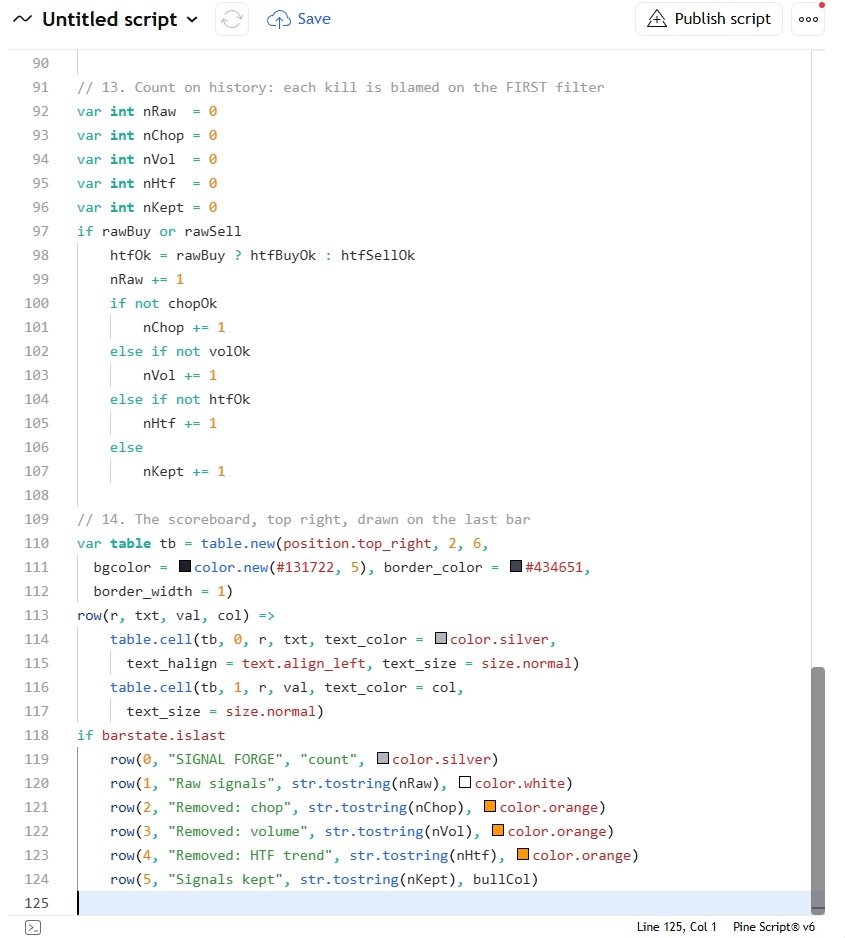
In TradingView: open the Pine Editor, create a new indicator, paste the code, then click "Add to chart".
//@version=6
// Signal Forge, part 2: killing fake signals. By Jayadev Rana.
indicator("Signal Forge", overlay = true)
// 1. Inputs: how far the trail sits, and the trend baseline
atrLen  = input.int(10, "ATR length", minval = 1)
atrMult = input.float(3.0, "ATR multiplier", minval = 0.5, step = 0.1)
emaLen  = input.int(200, "Trend EMA length", minval = 1)
useEma  = input.bool(true, "Only signal with the EMA trend")
bullCol = input.color(#26a69a, "Bull colour")
bearCol = input.color(#ef5350, "Bear colour")
// 2. Volatility and trend
atr = ta.atr(atrLen)
ema = ta.ema(close, emaLen)
// 3. The trail: it only ever moves in the trend's favour
longStop  = close - atrMult * atr
shortStop = close + atrMult * atr
var float trail = na
var int   dir   = 1
if na(trail)
    trail := longStop
else if dir == 1
    trail := math.max(trail, longStop)
    if close < trail
        dir   := -1
        trail := shortStop
else
    trail := math.min(trail, shortStop)
    if close > trail
        dir   := 1
        trail := longStop
// 4. Draw the trail by direction, and shade it to price
upLine = dir == 1 ? trail : na
dnLine = dir == -1 ? trail : na
pMid = plot(hl2, "Mid", display = display.none)
pUp  = plot(upLine, "Bull trail", bullCol, 2, plot.style_linebr)
pDn  = plot(dnLine, "Bear trail", bearCol, 2, plot.style_linebr)
fill(pMid, pUp, color.new(bullCol, 85), "Bull zone")
fill(pMid, pDn, color.new(bearCol, 85), "Bear zone")
plot(ema, "Trend EMA", color.orange, 2)
// 5. Candles: coloured when trail and EMA agree, grey when not
bullOk = dir == 1 and (not useEma or close > ema)
bearOk = dir == -1 and (not useEma or close < ema)
barcolor(bullOk ? bullCol : bearOk ? bearCol : color.gray)
// 6. Raw signals: a flip, with the trend, on a CLOSED candle only
flipUp   = dir == 1 and dir[1] == -1
flipDown = dir == -1 and dir[1] == 1
rawBuy   = flipUp and bullOk and barstate.isconfirmed
rawSell  = flipDown and bearOk and barstate.isconfirmed

// 7. Filter switches and settings
useChop = input.bool(true, "Chop filter (ADX)", group = "Filters")
adxLen  = input.int(14, "ADX length", minval = 1, group = "Filters")
adxMin  = input.float(20, "Minimum ADX", minval = 0, group = "Filters")
useVol  = input.bool(true, "Volume filter", group = "Filters")
volLen  = input.int(20, "Volume average length", group = "Filters")
volMult = input.float(1.0, "Volume multiple", step = 0.1, group = "Filters")
useHtf  = input.bool(true, "Higher timeframe filter", group = "Filters")
htfTf   = input.timeframe("240", "Higher timeframe", group = "Filters")
htfLen  = input.int(50, "Higher timeframe EMA", group = "Filters")

// 8. Chop filter: no signal when ADX says there is no trend
[diPlus, diMinus, adx] = ta.dmi(adxLen, adxLen)
chopOk = not useChop or adx >= adxMin

// 9. Volume filter: the flip candle must beat average volume
volAvg = ta.sma(volume, volLen)
volOk  = not useVol or volume > volAvg * volMult

// 10. Higher timeframe: last CLOSED candle only, never the live one
[htfC, htfE] = request.security(syminfo.tickerid, htfTf,
  [close[1], ta.ema(close, htfLen)[1]],
  lookahead = barmerge.lookahead_on)
htfBuyOk  = not useHtf or htfC > htfE
htfSellOk = not useHtf or htfC < htfE

// 11. Final signals: the raw signal AND every filter that is on
buy  = rawBuy and chopOk and volOk and htfBuyOk
sell = rawSell and chopOk and volOk and htfSellOk
plotshape(buy, "BUY", shape.labelup, location.belowbar, bullCol,
  text = "BUY", textcolor = color.white, size = size.small)
plotshape(sell, "SELL", shape.labeldown, location.abovebar, bearCol,
  text = "SELL", textcolor = color.white, size = size.small)
alertcondition(buy, "Signal Forge BUY", "BUY {{ticker}} at {{close}}")
alertcondition(sell, "Signal Forge SELL", "SELL {{ticker}} at {{close}}")

// 12. Ghosts: a small grey cross wherever a raw signal was killed
killed = (rawBuy or rawSell) and not (buy or sell)
plotshape(killed, "Filtered out", shape.xcross, location.abovebar,
  color.gray, size = size.tiny)

// 13. Count on history: each kill is blamed on the FIRST filter
var int nRaw  = 0
var int nChop = 0
var int nVol  = 0
var int nHtf  = 0
var int nKept = 0
if rawBuy or rawSell
    htfOk = rawBuy ? htfBuyOk : htfSellOk
    nRaw += 1
    if not chopOk
        nChop += 1
    else if not volOk
        nVol += 1
    else if not htfOk
        nHtf += 1
    else
        nKept += 1

// 14. The scoreboard, top right, drawn on the last bar
var table tb = table.new(position.top_right, 2, 6,
  bgcolor = color.new(#131722, 5), border_color = #434651,
  border_width = 1)
row(r, txt, val, col) =>
    table.cell(tb, 0, r, txt, text_color = color.silver,
      text_halign = text.align_left, text_size = size.normal)
    table.cell(tb, 1, r, val, text_color = col,
      text_size = size.normal)
if barstate.islast
    row(0, "SIGNAL FORGE", "count", color.silver)
    row(1, "Raw signals", str.tostring(nRaw), color.white)
    row(2, "Removed: chop", str.tostring(nChop), color.orange)
    row(3, "Removed: volume", str.tostring(nVol), color.orange)
    row(4, "Removed: HTF trend", str.tostring(nHtf), color.orange)
    row(5, "Signals kept", str.tostring(nKept), bullCol)
Watch it built
This script is written and explained step by step in the video lesson.
Need a custom indicator or strategy?
Non-repainting Pine Script v6, backtested with real costs, alert and webhook ready. Fixed quote within 24 hours.