Snapshots
How it works
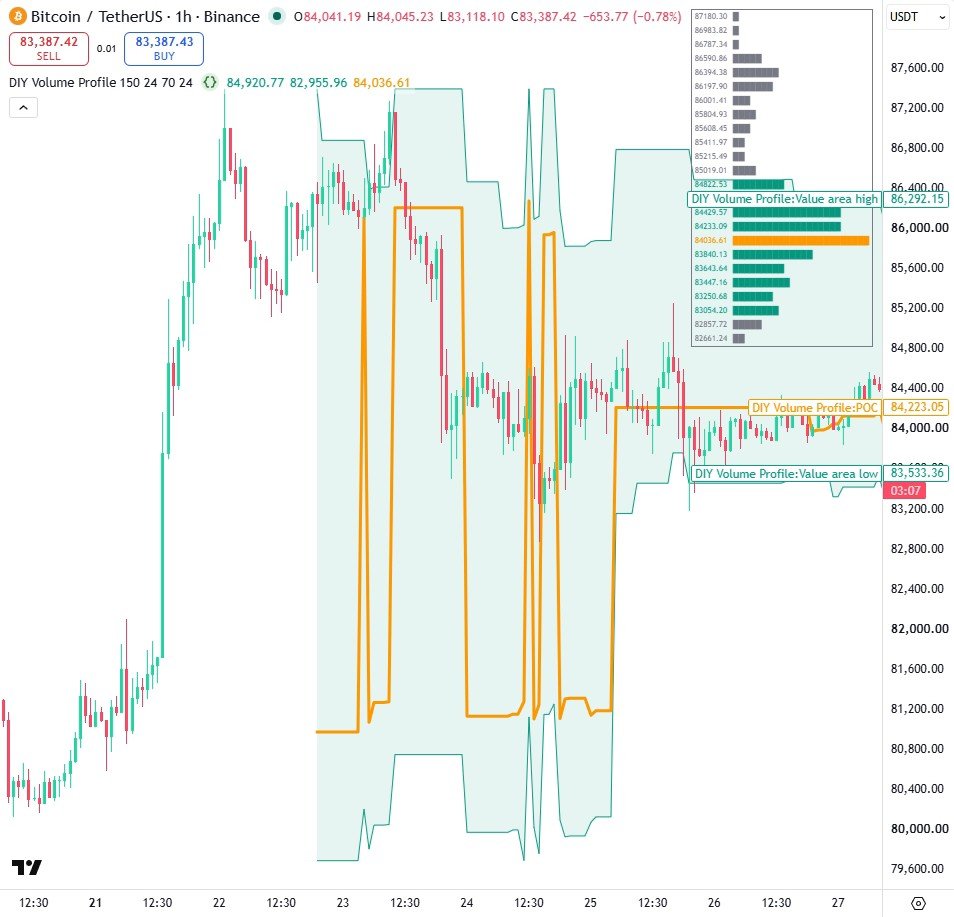
- Each candle's volume is split across the price rows its high to low range overlaps, in proportion to the overlap.
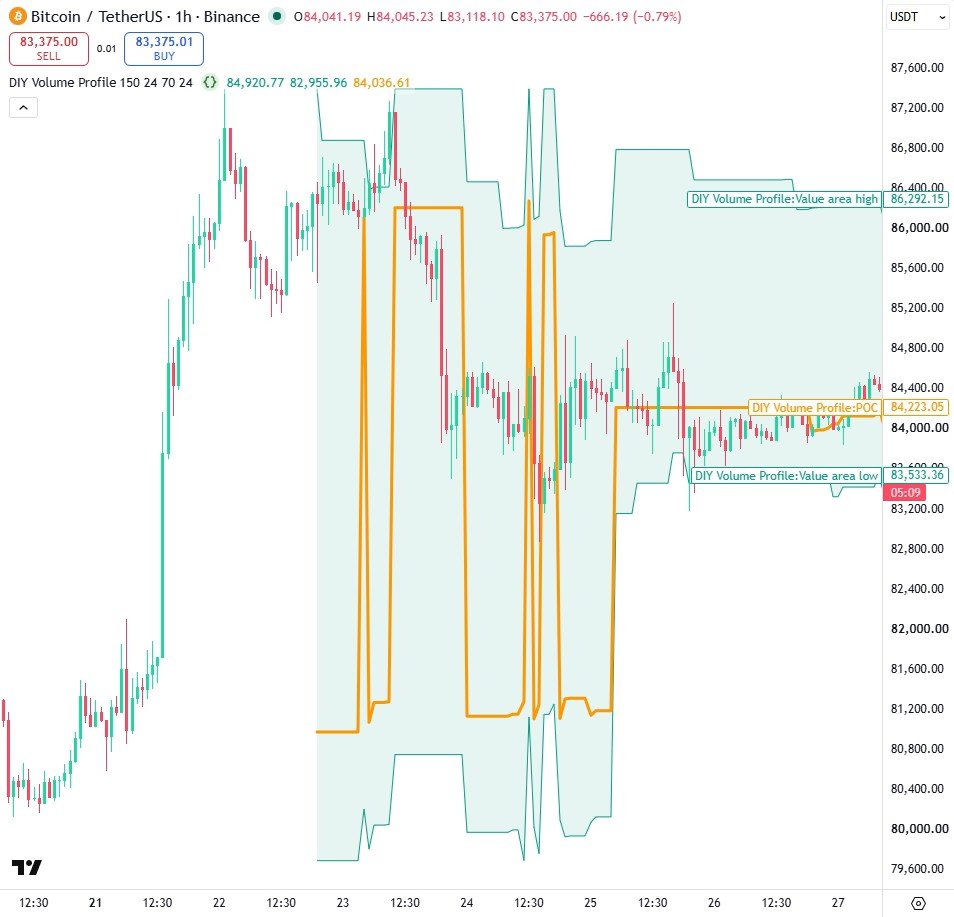
- The POC is the row with the most volume; the value area adds whichever neighbouring row is larger until it holds 70% of the volume.
- The lines are rolling (a plot cannot be redrawn into the past), and the histogram table is built only on the last bar.
Settings
| Setting | Default | What it does |
|---|---|---|
| Bars in the profile | 150 | How many candles the profile covers |
| Price rows | 24 | Vertical resolution of the profile |
| Value area % | 70 | Share of volume inside the value area |
| Widest row, in blocks | 24 | Width of the busiest histogram row |
Source code
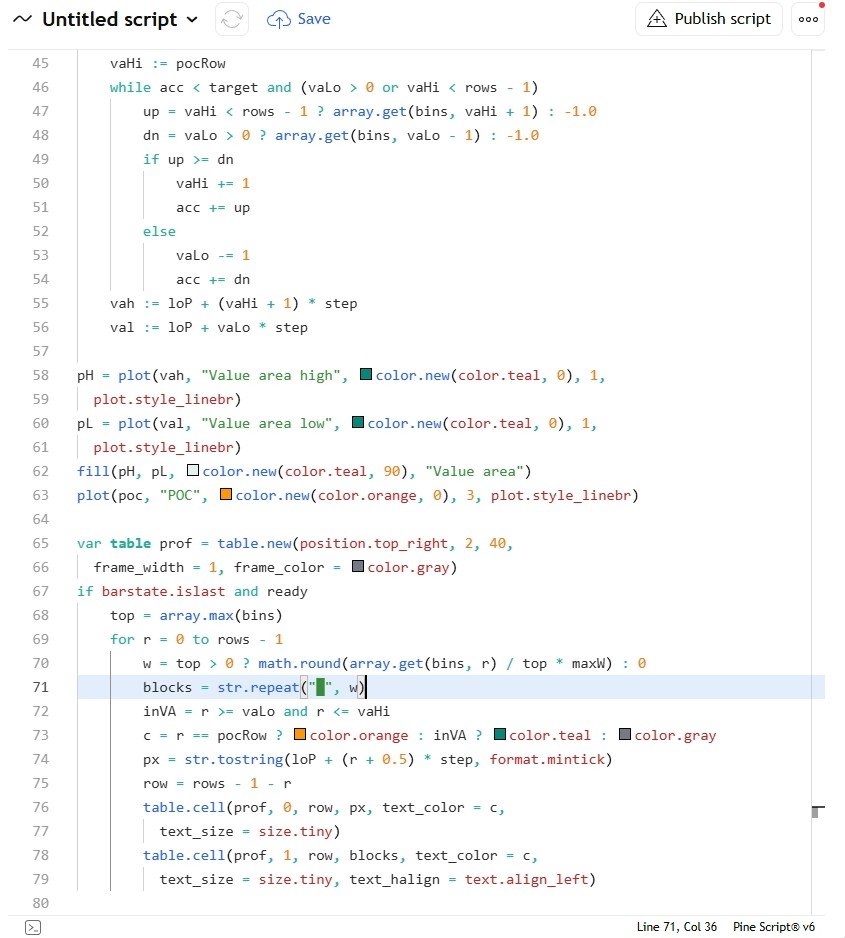
In TradingView: open the Pine Editor, create a new indicator, paste the code, then click "Add to chart".
//@version=6
indicator("DIY Volume Profile", overlay = true, max_bars_back = 500)

lookback = input.int(150, "Bars in the profile", minval = 20, maxval = 400)
rows = input.int(24, "Price rows", minval = 6, maxval = 40)
vaPct = input.float(70, "Value area %", minval = 10, maxval = 95)
maxW = input.int(24, "Widest row, in blocks", minval = 4, maxval = 40)

var array<float> bins = array.new_float(rows, 0)
float poc = na
float vah = na
float val = na
int pocRow = na
int vaLo = na
int vaHi = na

hiP = ta.highest(high, lookback)
loP = ta.lowest(low, lookback)
step = (hiP - loP) / rows
inWindow = bar_index >= last_bar_index - lookback + 1
ready = inWindow and step > 0

if ready
    array.fill(bins, 0)
    for i = 0 to lookback - 1
        h = high[i]
        l = low[i]
        v = nz(volume[i])
        a = math.min(rows - 1, math.max(0, math.floor((l - loP) / step)))
        b = math.min(rows - 1, math.max(0, math.floor((h - loP) / step)))
        for r = a to b
            rLo = loP + r * step
            part = math.min(h, rLo + step) - math.max(l, rLo)
            share = h > l ? math.max(0, part) / (h - l) : 1.0
            array.set(bins, r, array.get(bins, r) + v * share)

if ready
    pocRow := array.indexof(bins, array.max(bins))
    poc := loP + (pocRow + 0.5) * step

if ready
    target = array.sum(bins) * vaPct / 100
    acc = array.get(bins, pocRow)
    vaLo := pocRow
    vaHi := pocRow
    while acc < target and (vaLo > 0 or vaHi < rows - 1)
        up = vaHi < rows - 1 ? array.get(bins, vaHi + 1) : -1.0
        dn = vaLo > 0 ? array.get(bins, vaLo - 1) : -1.0
        if up >= dn
            vaHi += 1
            acc += up
        else
            vaLo -= 1
            acc += dn
    vah := loP + (vaHi + 1) * step
    val := loP + vaLo * step

pH = plot(vah, "Value area high", color.new(color.teal, 0), 1,
  plot.style_linebr)
pL = plot(val, "Value area low", color.new(color.teal, 0), 1,
  plot.style_linebr)
fill(pH, pL, color.new(color.teal, 90), "Value area")
plot(poc, "POC", color.new(color.orange, 0), 3, plot.style_linebr)

var table prof = table.new(position.top_right, 2, 40,
  frame_width = 1, frame_color = color.gray)
if barstate.islast and ready
    top = array.max(bins)
    for r = 0 to rows - 1
        w = top > 0 ? math.round(array.get(bins, r) / top * maxW) : 0
        blocks = str.repeat("█", w)
        inVA = r >= vaLo and r <= vaHi
        c = r == pocRow ? color.orange : inVA ? color.teal : color.gray
        px = str.tostring(loP + (r + 0.5) * step, format.mintick)
        row = rows - 1 - r
        table.cell(prof, 0, row, px, text_color = c,
          text_size = size.tiny)
        table.cell(prof, 1, row, blocks, text_color = c,
          text_size = size.tiny, text_halign = text.align_left)
Watch it built
This script is written and explained step by step in the video lesson.
Need a custom indicator or strategy?
Non-repainting Pine Script v6, backtested with real costs, alert and webhook ready. Fixed quote within 24 hours.