Snapshots
How it works
- stopDist = ATR x multiplier, so the stop fits how far price is actually moving today.
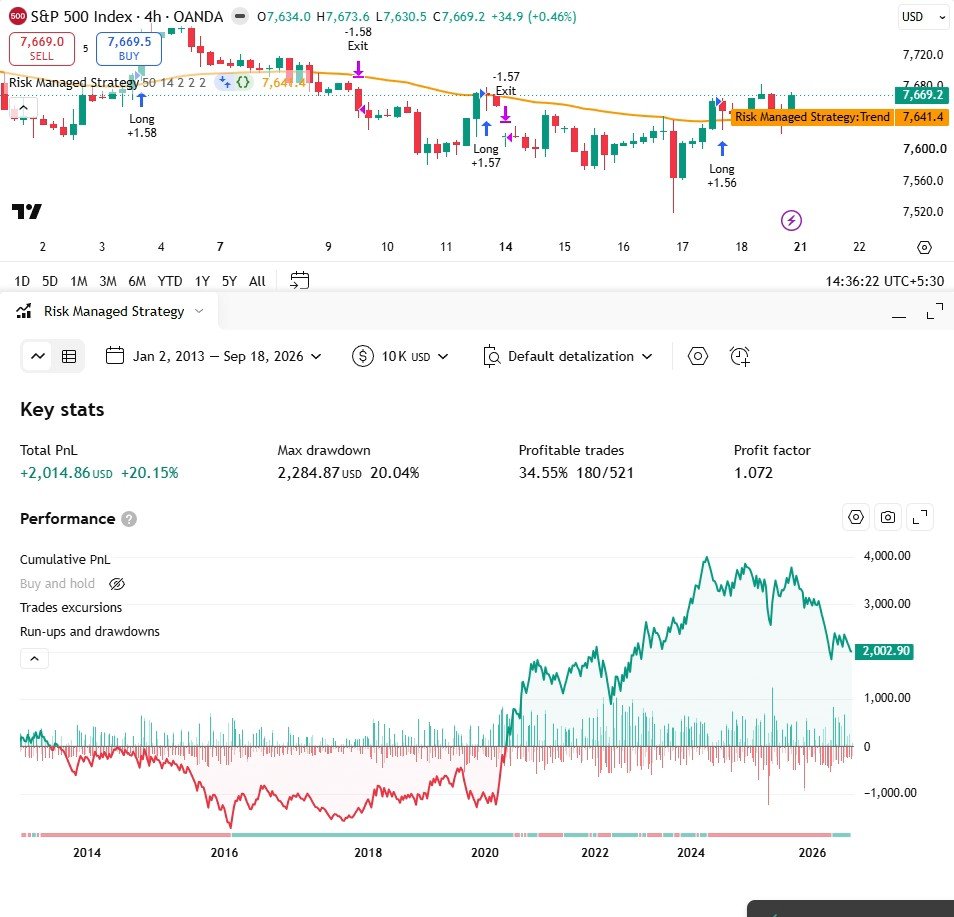
- qty = math.min(riskCash / stopDist, equity / close): every loss costs the same, and the size never exceeds what the account can fund.
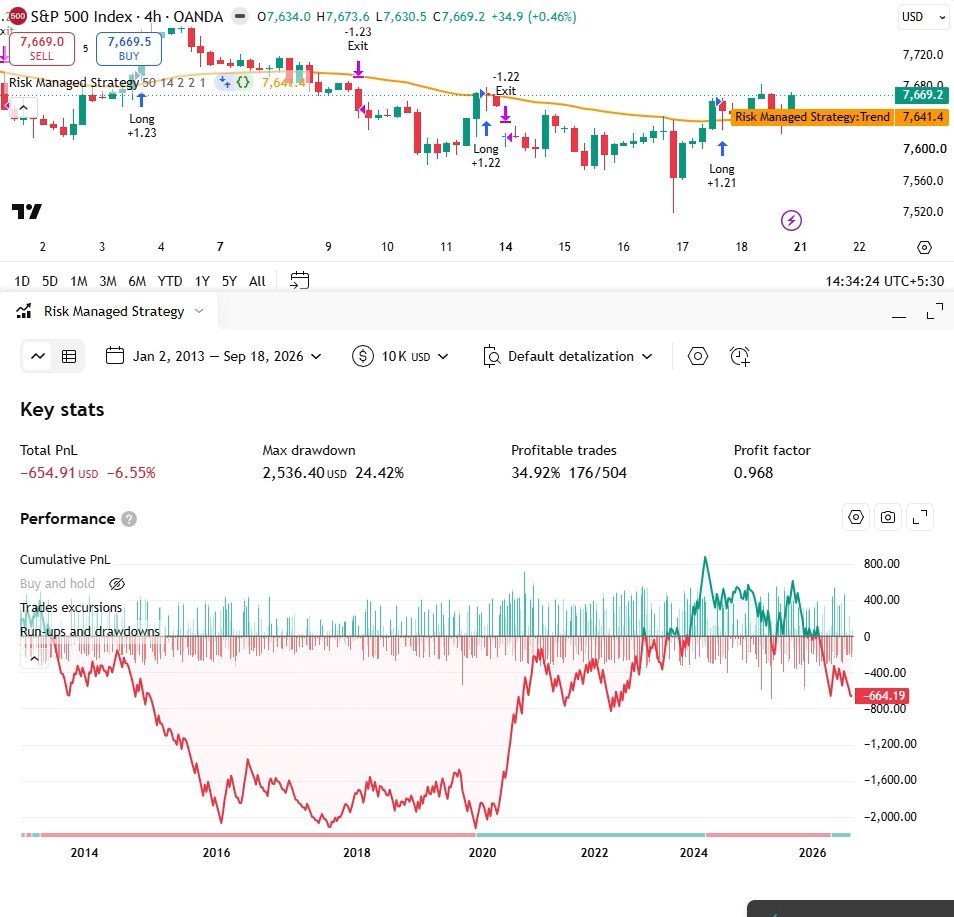
- A tighter stop means more trades (199 in lesson 5 became 504 here), and every extra trade pays commission and slippage.
Settings
| Setting | Default | What it does |
|---|---|---|
| Trend average length | 50 | EMA used as the trend line |
| ATR length | 14 | Length of the average true range |
| Stop = ATR x | 2.0 | How many ATR away the stop sits |
| Target = risk x | 2.0 | Target distance as a multiple of the stop |
| Risk % of equity | 1.0 | How much of the account a single stop loss costs |
Source code
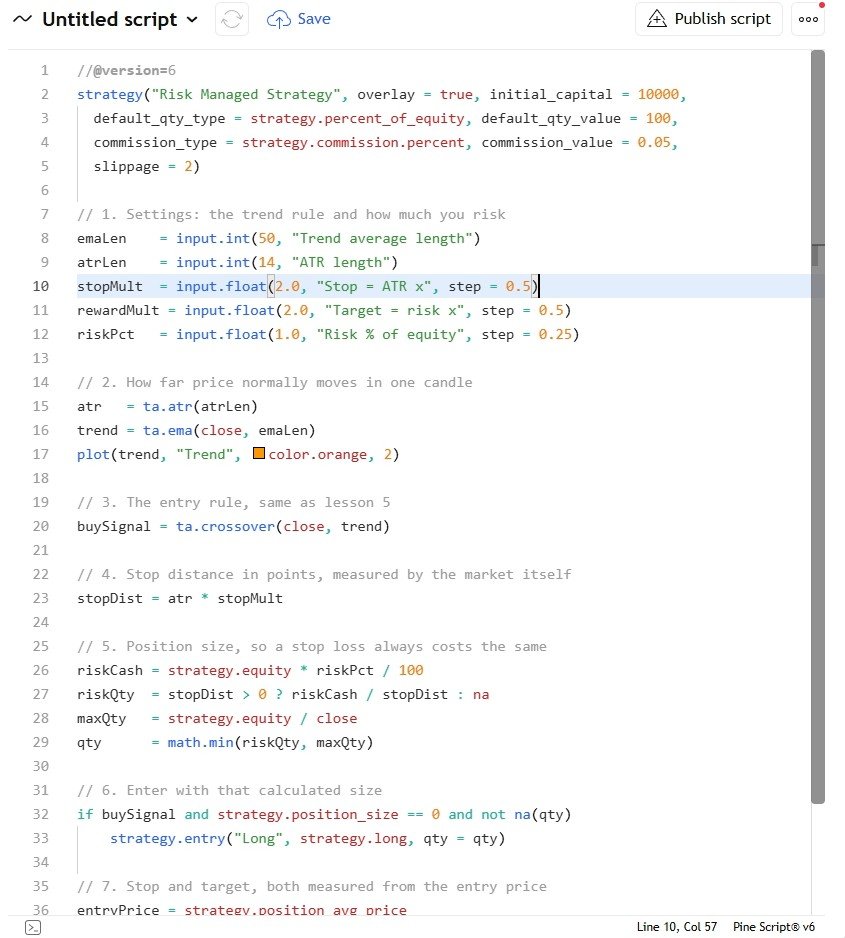
In TradingView: open the Pine Editor, create a new strategy, paste the code, then click "Add to chart".
//@version=6
strategy("Risk Managed Strategy", overlay = true, initial_capital = 10000,
  default_qty_type = strategy.percent_of_equity, default_qty_value = 100,
  commission_type = strategy.commission.percent, commission_value = 0.05,
  slippage = 2)

// 1. Settings: the trend rule and how much you risk
emaLen    = input.int(50, "Trend average length")
atrLen    = input.int(14, "ATR length")
stopMult  = input.float(2.0, "Stop = ATR x", step = 0.5)
rewardMult = input.float(2.0, "Target = risk x", step = 0.5)
riskPct   = input.float(1.0, "Risk % of equity", step = 0.25)

// 2. How far price normally moves in one candle
atr   = ta.atr(atrLen)
trend = ta.ema(close, emaLen)
plot(trend, "Trend", color.orange, 2)

// 3. The entry rule, same as lesson 5
buySignal = ta.crossover(close, trend)

// 4. Stop distance in points, measured by the market itself
stopDist = atr * stopMult

// 5. Position size, so a stop loss always costs the same
riskCash = strategy.equity * riskPct / 100
riskQty  = stopDist > 0 ? riskCash / stopDist : na
maxQty   = strategy.equity / close
qty      = math.min(riskQty, maxQty)

// 6. Enter with that calculated size
if buySignal and strategy.position_size == 0 and not na(qty)
    strategy.entry("Long", strategy.long, qty = qty)

// 7. Stop and target, both measured from the entry price
entryPrice = strategy.position_avg_price
stopPrice  = entryPrice - stopDist
takePrice  = entryPrice + stopDist * rewardMult
if strategy.position_size > 0
    strategy.exit("Exit", "Long", stop = stopPrice, limit = takePrice)
Watch it built
This script is written and explained step by step in the video lesson.
Need a custom indicator or strategy?
Non-repainting Pine Script v6, backtested with real costs, alert and webhook ready. Fixed quote within 24 hours.