Snapshots
How it works
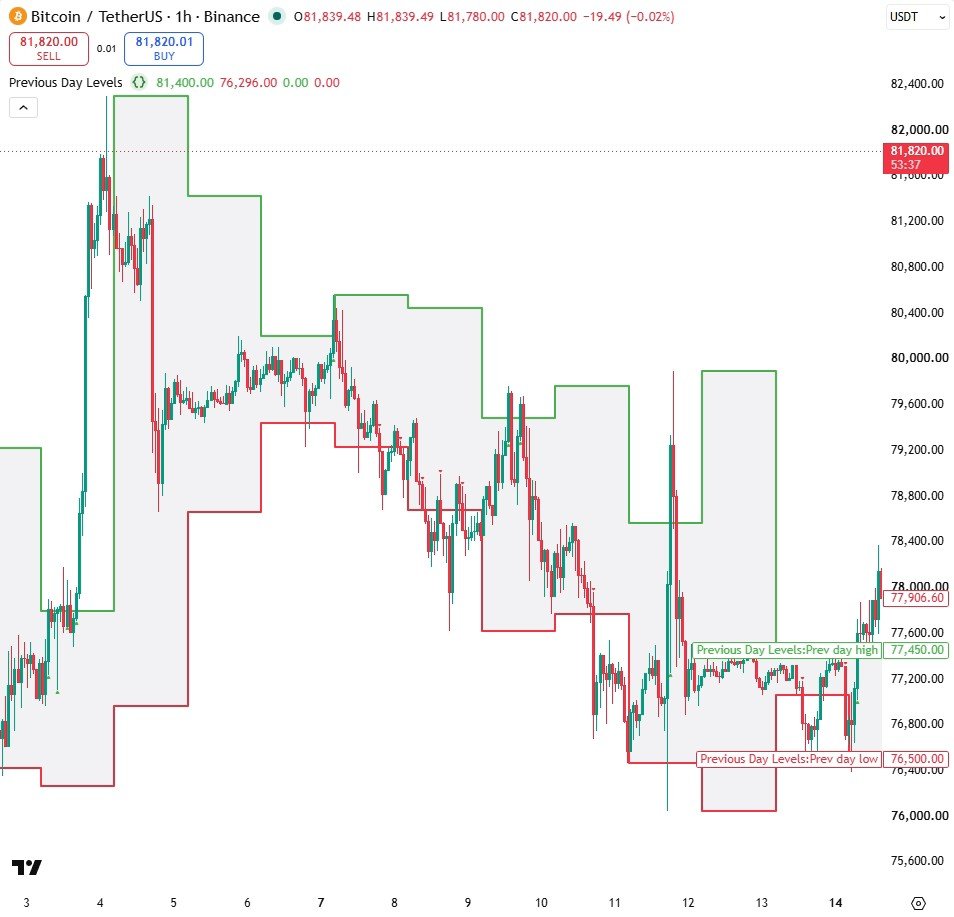
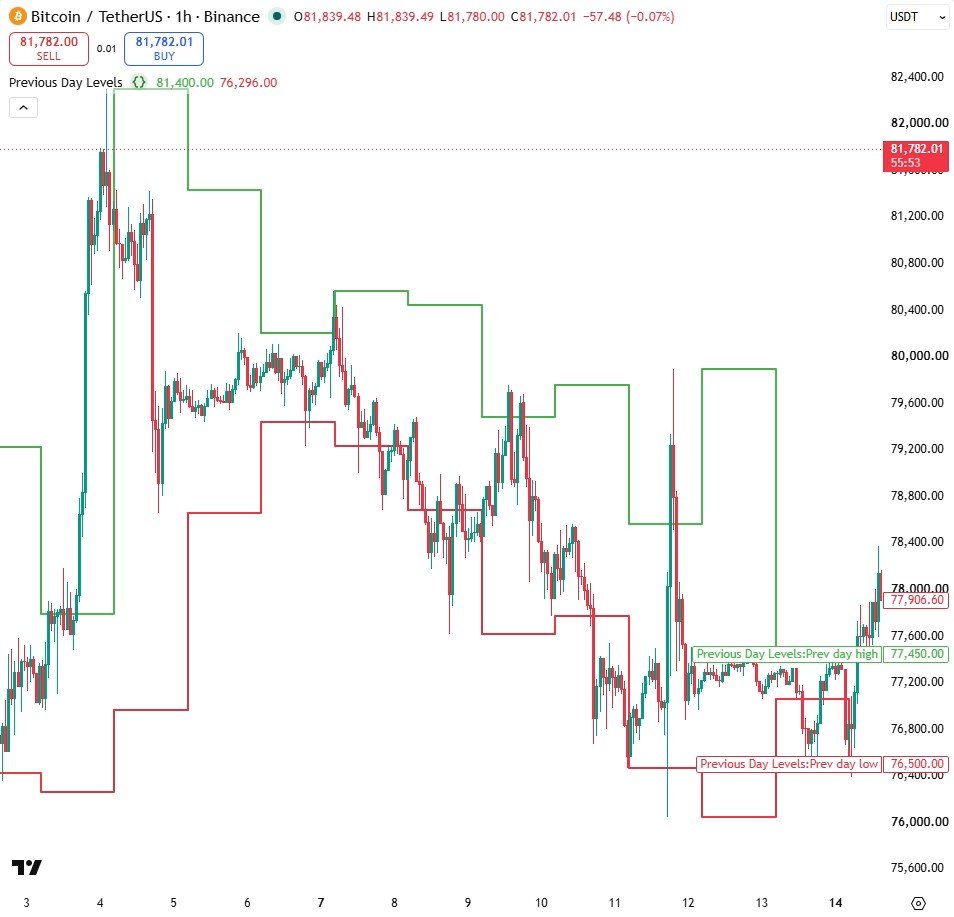
- request.security reads high[1] and low[1] from the daily timeframe, so the levels are yesterday's finished values.
- lookahead is only safe here because of the [1]: the script never uses data from an unfinished day.
- Create an alert on "Previous Day Levels" and pick "Broke yesterday's high" or "Broke yesterday's low".
Settings
| Setting | Default | What it does |
|---|---|---|
| High colour | green | Colour of yesterday's high line |
| Low colour | red | Colour of yesterday's low line |
Source code
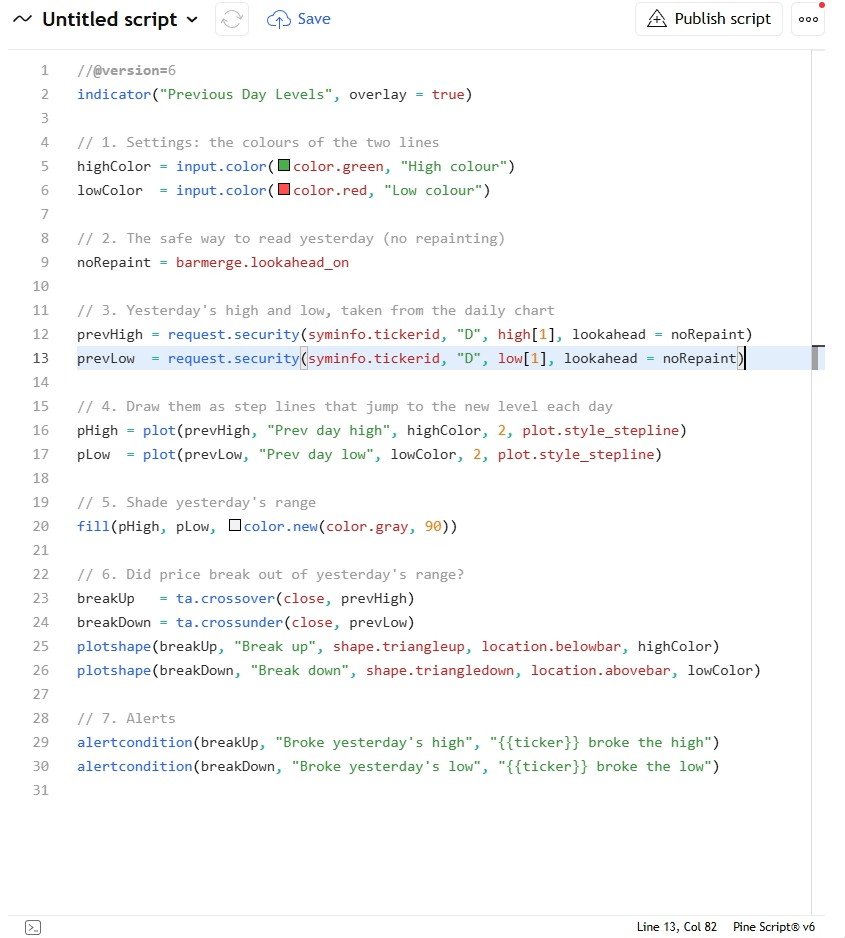
In TradingView: open the Pine Editor, create a new indicator, paste the code, then click "Add to chart".
//@version=6
indicator("Previous Day Levels", overlay = true)

// 1. Settings: the colours of the two lines
highColor = input.color(color.green, "High colour")
lowColor  = input.color(color.red, "Low colour")

// 2. The safe way to read yesterday (no repainting)
noRepaint = barmerge.lookahead_on

// 3. Yesterday's high and low, taken from the daily chart
prevHigh = request.security(syminfo.tickerid, "D", high[1], lookahead = noRepaint)
prevLow  = request.security(syminfo.tickerid, "D", low[1], lookahead = noRepaint)

// 4. Draw them as step lines that jump to the new level each day
pHigh = plot(prevHigh, "Prev day high", highColor, 2, plot.style_stepline)
pLow  = plot(prevLow, "Prev day low", lowColor, 2, plot.style_stepline)

// 5. Shade yesterday's range
fill(pHigh, pLow, color.new(color.gray, 90))

// 6. Did price break out of yesterday's range?
breakUp   = ta.crossover(close, prevHigh)
breakDown = ta.crossunder(close, prevLow)
plotshape(breakUp, "Break up", shape.triangleup, location.belowbar, highColor)
plotshape(breakDown, "Break down", shape.triangledown, location.abovebar, lowColor)

// 7. Alerts
alertcondition(breakUp, "Broke yesterday's high", "{{ticker}} broke the high")
alertcondition(breakDown, "Broke yesterday's low", "{{ticker}} broke the low")
Watch it built
This script is written and explained step by step in the video lesson.
Need a custom indicator or strategy?
Non-repainting Pine Script v6, backtested with real costs, alert and webhook ready. Fixed quote within 24 hours.