Snapshots
How it works
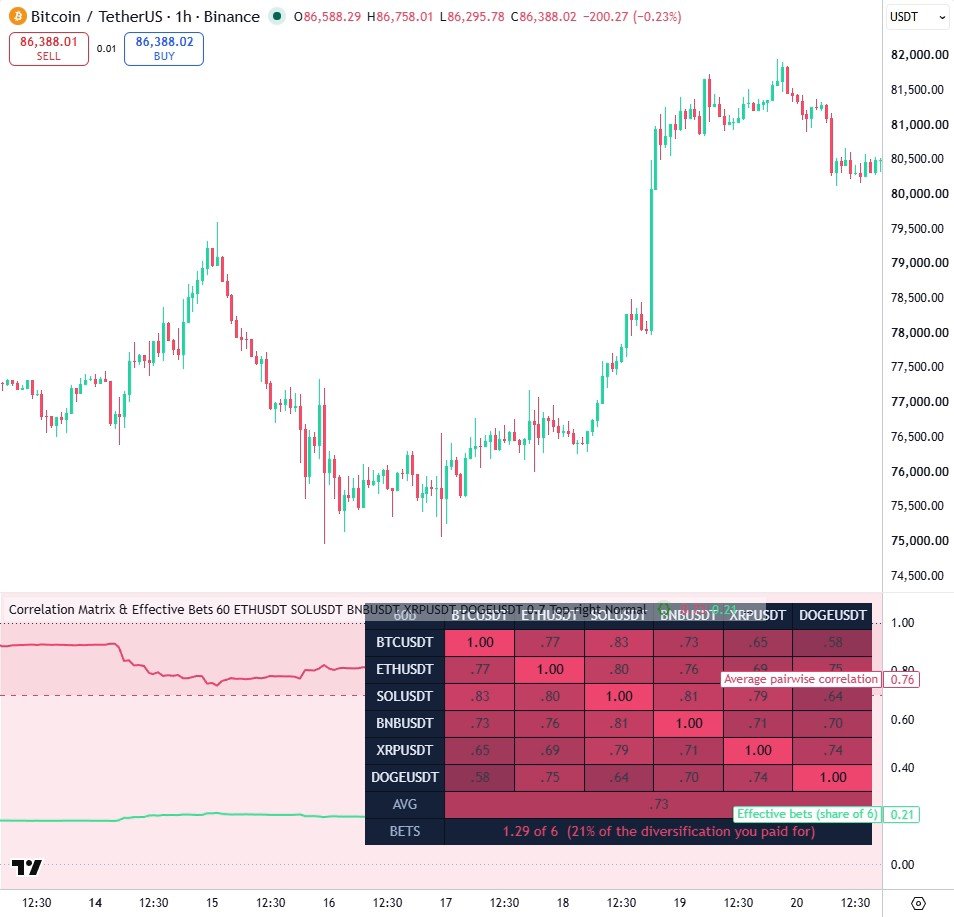
- Each pair's correlation is measured over the same lookback on closed bars, then rendered as a coloured table cell.
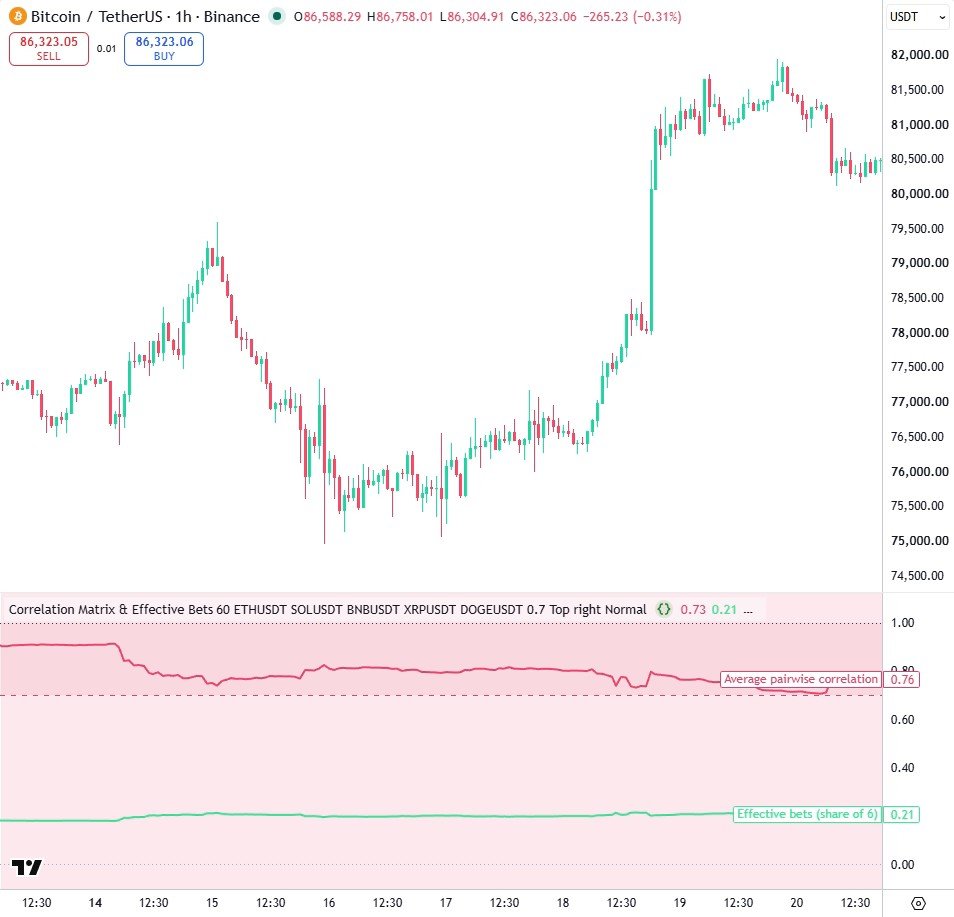
- Effective bets is computed from the average correlation: it falls towards one as the basket becomes one trade wearing six tickers.
- The symbols are inputs rather than a loop, because Pine requires a constant symbol in request.security.
Settings
| Setting | Default | What it does |
|---|---|---|
| Correlation length | 60 | Bars each pairwise correlation is measured over |
| Symbol 1 | BINANCE:ETHUSDT | First comparison symbol |
| Symbol 2 | BINANCE:SOLUSDT | Second comparison symbol |
| Symbol 3 | BINANCE:BNBUSDT | Third comparison symbol |
| Symbol 4 | BINANCE:XRPUSDT | Fourth comparison symbol |
| Symbol 5 | BINANCE:DOGEUSDT | Fifth comparison symbol |
| Crowded above | 0.70 | Correlation above which two positions count as one trade |
| Table position | Top right | Where the matrix sits on the pane |
Source code
In TradingView: open the Pine Editor, create a new indicator, paste the code, then click "Add to chart".
//@version=6
// A live correlation matrix for six symbols, plus the number that actually matters:
// how many INDEPENDENT positions your basket really contains.
indicator("Correlation Matrix & Effective Bets", overlay = false, precision = 2)
// How many bars of history each correlation is measured over.
len = input.int(60, "Correlation length", minval = 10, maxval = 500)
// The five comparison symbols, as inputs because request.security needs a
// constant symbol string and cannot take a series.
s1 = input.symbol("BINANCE:ETHUSDT", "Symbol 1")
s2 = input.symbol("BINANCE:SOLUSDT", "Symbol 2")
s3 = input.symbol("BINANCE:BNBUSDT", "Symbol 3")
s4 = input.symbol("BINANCE:XRPUSDT", "Symbol 4")
s5 = input.symbol("BINANCE:DOGEUSDT", "Symbol 5")
// Above this average correlation the basket counts as one crowded trade.
hiLevel = input.float(0.70, "Crowded above", minval = 0.0, maxval = 1.0, step = 0.05)
// Where the matrix sits on the pane, and how big its text is.
tabPos = input.string("Top right", "Table position",
     options = ["Top right", "Top left", "Bottom right", "Bottom left"])
txtSize = input.string("Normal", "Text size", options = ["Tiny", "Small", "Normal"])

// The palette, named once so every table line below stays short and readable.
DK = #0b1220
HDR = #16233a
TXT = #e8eefc
DIM = #9fb0cc
RED = #ef476f
TEAL = #3ddc97
YEL = #ffd166

// Strips the exchange prefix so "BINANCE:ETHUSDT" prints as "ETHUSDT".
f_short(string sym) =>
    // Split on the colon that separates the exchange from the ticker.
    parts = str.split(sym, ":")
    // The ticker is whatever came last, which also handles unprefixed symbols.
    array.get(parts, array.size(parts) - 1)

// Formats a correlation for a cell, two decimals, no exponent nonsense.
f_num(float v) =>
    // A missing feed prints as a dash instead of a misleading zero.
    na(v) ? "-" : str.tostring(v, "#.00")

// Turns a correlation into a cell colour: red at +1, dark at 0, teal at -1.
f_cell(float v) =>
    // Positive correlations fade from the dark background up to red.
    up = color.from_gradient(nz(v), 0.0, 1.0, HDR, RED)
    // Negative ones fade from the dark background down to teal.
    dn = color.from_gradient(nz(v), -1.0, 0.0, TEAL, HDR)
    // A missing feed is flat grey rather than pretending to be zero.
    na(v) ? color.new(#2c3a52, 40) : v >= 0 ? up : dn

// The log return of whatever symbol the chart is on. Returns, never prices:
// two rising series correlate just because both rise, which tells you nothing.
r0 = math.log(close / close[1])
// The same log return, each one computed inside its own symbol's context.
r1 = request.security(s1, timeframe.period, math.log(close / close[1]))
r2 = request.security(s2, timeframe.period, math.log(close / close[1]))
r3 = request.security(s3, timeframe.period, math.log(close / close[1]))
r4 = request.security(s4, timeframe.period, math.log(close / close[1]))
r5 = request.security(s5, timeframe.period, math.log(close / close[1]))

// Every pair, on every bar, because a ta function must never sit inside an if.
c01 = ta.correlation(r0, r1, len)
c02 = ta.correlation(r0, r2, len)
c03 = ta.correlation(r0, r3, len)
c04 = ta.correlation(r0, r4, len)
c05 = ta.correlation(r0, r5, len)
c12 = ta.correlation(r1, r2, len)
c13 = ta.correlation(r1, r3, len)
c14 = ta.correlation(r1, r4, len)
c15 = ta.correlation(r1, r5, len)
c23 = ta.correlation(r2, r3, len)
c24 = ta.correlation(r2, r4, len)
c25 = ta.correlation(r2, r5, len)
c34 = ta.correlation(r3, r4, len)
c35 = ta.correlation(r3, r5, len)
c45 = ta.correlation(r4, r5, len)

// Six symbols make fifteen unique pairs, so their sum divided by fifteen is
// the average pairwise correlation of the whole basket.
sumPairs = nz(c01) + nz(c02) + nz(c03) + nz(c04) + nz(c05) + nz(c12) + nz(c13) +
     nz(c14) + nz(c15) + nz(c23) + nz(c24) + nz(c25) + nz(c34) + nz(c35) + nz(c45)
// The size of the basket, used by both formulas below.
nSym = 6.0
// One number for how crowded the basket is right now.
avgCorr = sumPairs / 15.0
// Equal weights means every weight is 1/n, so (sum w)^2 is one and w'Cw is the
// mean entry of the matrix. Effective bets then collapses to this expression.
effBets = nSym / (1.0 + (nSym - 1.0) * avgCorr)
// How much of the diversification you thought you bought actually survived.
keptPct = 100.0 * effBets / nSym
// The colour of a perfect one-point-zero cell, reused down the diagonal.
ONE = f_cell(1.0)

// The average pairwise correlation, drawn so you can watch it move.
plot(avgCorr, "Average pairwise correlation", color = RED, linewidth = 2)
// The effective bet count rescaled onto the same zero-to-one axis.
plot(effBets / nSym, "Effective bets (share of 6)", color = TEAL, linewidth = 2)
// Zero correlation: where six positions would genuinely be six bets.
hline(0.0, "Uncorrelated", color = DIM, linestyle = hline.style_dotted)
// Perfect correlation, the ceiling of the danger band.
hTop = hline(1.0, "One", color = #2c3a52, linestyle = hline.style_dotted)
// The crowding threshold, drawn so breaches of it are obvious.
hHi = hline(hiLevel, "Crowded", color = RED, linestyle = hline.style_dashed)
// Shade the band between crowded and perfect.
fill(hHi, hTop, color = color.new(RED, 90), title = "Crowded zone")
// Wash the pane red on bars where the basket has collapsed into one trade.
bgcolor(avgCorr > hiLevel ? color.new(RED, 88) : na, title = "Crowded bars")
// Mark the bar where crowding crosses the threshold, so spikes are countable.
plotshape(ta.crossover(avgCorr, hiLevel), "Crowding spike", shape.triangleup,
     location.top, YEL, size = size.tiny)

// One table, created once, then rewritten on the last bar only.
var table mx = table.new(
     tabPos == "Top right" ? position.top_right :
     tabPos == "Top left" ? position.top_left :
     tabPos == "Bottom right" ? position.bottom_right : position.bottom_left,
     7, 9, border_width = 1, border_color = DK)
// Map the text-size input onto the constants the cells expect.
TS = txtSize == "Tiny" ? size.tiny : txtSize == "Small" ? size.small : size.normal
// Short names for the header, the chart's own ticker first.
n0 = syminfo.ticker
n1 = f_short(s1)
n2 = f_short(s2)
n3 = f_short(s3)
n4 = f_short(s4)
n5 = f_short(s5)

// The headers only need drawing once, on the most recent bar.
if barstate.islast
    // The corner cell says what window the numbers were measured over.
    table.cell(mx, 0, 0, str.tostring(len) + "b", text_color = DIM,
         text_size = TS, bgcolor = HDR)
    // Column headers across the top, one per symbol in the basket.
    table.cell(mx, 1, 0, n0, text_color = TXT, text_size = TS, bgcolor = HDR)
    table.cell(mx, 2, 0, n1, text_color = TXT, text_size = TS, bgcolor = HDR)
    table.cell(mx, 3, 0, n2, text_color = TXT, text_size = TS, bgcolor = HDR)
    table.cell(mx, 4, 0, n3, text_color = TXT, text_size = TS, bgcolor = HDR)
    table.cell(mx, 5, 0, n4, text_color = TXT, text_size = TS, bgcolor = HDR)
    table.cell(mx, 6, 0, n5, text_color = TXT, text_size = TS, bgcolor = HDR)
    // The same names down the left edge, so every cell has a row and a column.
    table.cell(mx, 0, 1, n0, text_color = TXT, text_size = TS, bgcolor = HDR)
    table.cell(mx, 0, 2, n1, text_color = TXT, text_size = TS, bgcolor = HDR)
    table.cell(mx, 0, 3, n2, text_color = TXT, text_size = TS, bgcolor = HDR)
    table.cell(mx, 0, 4, n3, text_color = TXT, text_size = TS, bgcolor = HDR)
    table.cell(mx, 0, 5, n4, text_color = TXT, text_size = TS, bgcolor = HDR)
    table.cell(mx, 0, 6, n5, text_color = TXT, text_size = TS, bgcolor = HDR)

// The matrix body: the diagonal is always one and the grid is symmetric.
if barstate.islast
    // Row one, the chart symbol against all six, starting with itself.
    table.cell(mx, 1, 1, "1.00", text_color = DK, text_size = TS, bgcolor = ONE)
    table.cell(mx, 2, 1, f_num(c01), text_size = TS, bgcolor = f_cell(c01))
    table.cell(mx, 3, 1, f_num(c02), text_size = TS, bgcolor = f_cell(c02))
    table.cell(mx, 4, 1, f_num(c03), text_size = TS, bgcolor = f_cell(c03))
    table.cell(mx, 5, 1, f_num(c04), text_size = TS, bgcolor = f_cell(c04))
    table.cell(mx, 6, 1, f_num(c05), text_size = TS, bgcolor = f_cell(c05))
    // Row two, symbol one, mirroring the values already computed above.
    table.cell(mx, 1, 2, f_num(c01), text_size = TS, bgcolor = f_cell(c01))
    table.cell(mx, 2, 2, "1.00", text_color = DK, text_size = TS, bgcolor = ONE)
    table.cell(mx, 3, 2, f_num(c12), text_size = TS, bgcolor = f_cell(c12))
    table.cell(mx, 4, 2, f_num(c13), text_size = TS, bgcolor = f_cell(c13))
    table.cell(mx, 5, 2, f_num(c14), text_size = TS, bgcolor = f_cell(c14))
    table.cell(mx, 6, 2, f_num(c15), text_size = TS, bgcolor = f_cell(c15))
    // Row three, symbol two against everything.
    table.cell(mx, 1, 3, f_num(c02), text_size = TS, bgcolor = f_cell(c02))
    table.cell(mx, 2, 3, f_num(c12), text_size = TS, bgcolor = f_cell(c12))
    table.cell(mx, 3, 3, "1.00", text_color = DK, text_size = TS, bgcolor = ONE)
    table.cell(mx, 4, 3, f_num(c23), text_size = TS, bgcolor = f_cell(c23))
    table.cell(mx, 5, 3, f_num(c24), text_size = TS, bgcolor = f_cell(c24))
    table.cell(mx, 6, 3, f_num(c25), text_size = TS, bgcolor = f_cell(c25))
    // Row four, symbol three against everything.
    table.cell(mx, 1, 4, f_num(c03), text_size = TS, bgcolor = f_cell(c03))
    table.cell(mx, 2, 4, f_num(c13), text_size = TS, bgcolor = f_cell(c13))
    table.cell(mx, 3, 4, f_num(c23), text_size = TS, bgcolor = f_cell(c23))
    table.cell(mx, 4, 4, "1.00", text_color = DK, text_size = TS, bgcolor = ONE)
    table.cell(mx, 5, 4, f_num(c34), text_size = TS, bgcolor = f_cell(c34))
    table.cell(mx, 6, 4, f_num(c35), text_size = TS, bgcolor = f_cell(c35))
    // Row five, symbol four against everything.
    table.cell(mx, 1, 5, f_num(c04), text_size = TS, bgcolor = f_cell(c04))
    table.cell(mx, 2, 5, f_num(c14), text_size = TS, bgcolor = f_cell(c14))
    table.cell(mx, 3, 5, f_num(c24), text_size = TS, bgcolor = f_cell(c24))
    table.cell(mx, 4, 5, f_num(c34), text_size = TS, bgcolor = f_cell(c34))
    table.cell(mx, 5, 5, "1.00", text_color = DK, text_size = TS, bgcolor = ONE)
    table.cell(mx, 6, 5, f_num(c45), text_size = TS, bgcolor = f_cell(c45))
    // Row six, symbol five against everything.
    table.cell(mx, 1, 6, f_num(c05), text_size = TS, bgcolor = f_cell(c05))
    table.cell(mx, 2, 6, f_num(c15), text_size = TS, bgcolor = f_cell(c15))
    table.cell(mx, 3, 6, f_num(c25), text_size = TS, bgcolor = f_cell(c25))
    table.cell(mx, 4, 6, f_num(c35), text_size = TS, bgcolor = f_cell(c35))
    table.cell(mx, 5, 6, f_num(c45), text_size = TS, bgcolor = f_cell(c45))
    table.cell(mx, 6, 6, "1.00", text_color = DK, text_size = TS, bgcolor = ONE)

// The two summary rows, which are the whole point of the indicator.
if barstate.islast
    // Label for the average of the fifteen unique pairs.
    table.cell(mx, 0, 7, "AVG", text_color = DIM, text_size = TS, bgcolor = HDR)
    // The average itself, coloured on the same scale as a matrix cell.
    table.cell(mx, 1, 7, f_num(avgCorr), text_size = TS, bgcolor = f_cell(avgCorr))
    // Stretch it across the rest of the row so it reads as a summary, not a pair.
    table.merge_cells(mx, 1, 7, 6, 7)
    // Label for the effective number of independent positions.
    table.cell(mx, 0, 8, "BETS", text_color = DIM, text_size = TS, bgcolor = HDR)
    // Six positions, and the honest count of how many bets they amount to.
    table.cell(mx, 1, 8, str.tostring(effBets, "#.00") + " of 6  (" +
         str.tostring(keptPct, "#") + "% of the diversification you paid for)",
         text_color = effBets < 2.0 ? RED : TEAL, text_size = TS, bgcolor = HDR)
    // Stretch that one too, because the sentence needs the room.
    table.merge_cells(mx, 1, 8, 6, 8)
Watch it built
This script is written and explained step by step in the video lesson.
Need a custom indicator or strategy?
Non-repainting Pine Script v6, backtested with real costs, alert and webhook ready. Fixed quote within 24 hours.