Snapshots
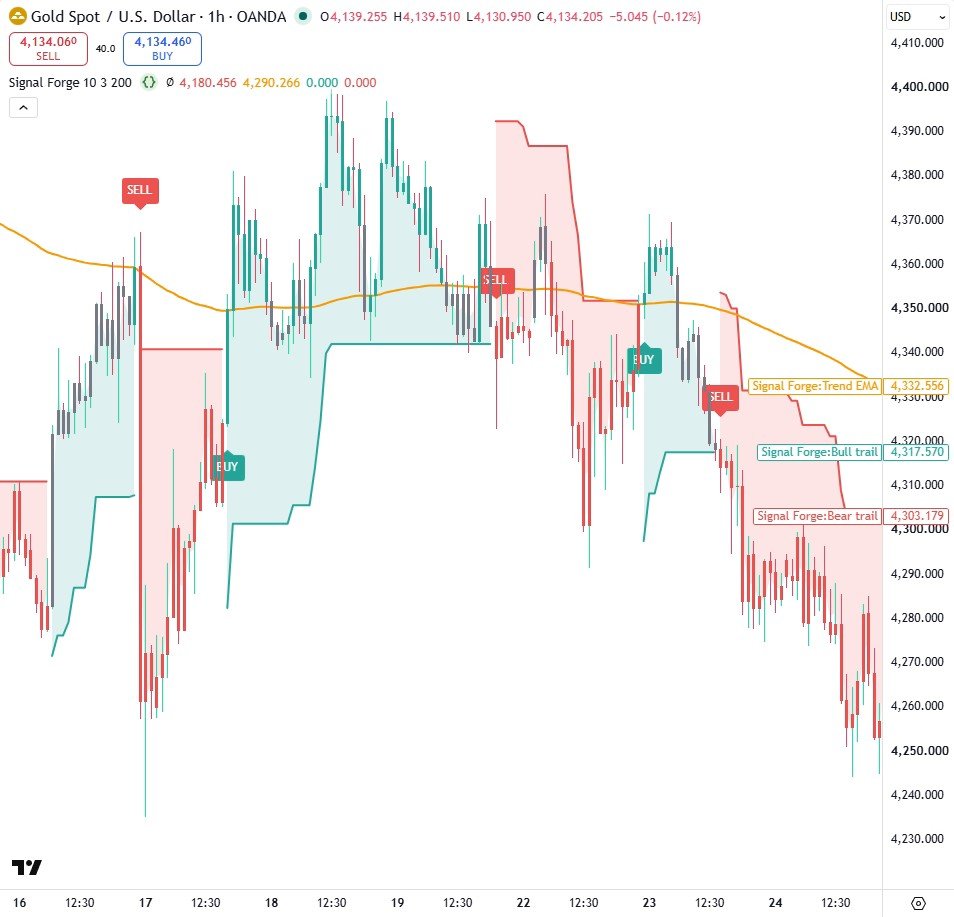
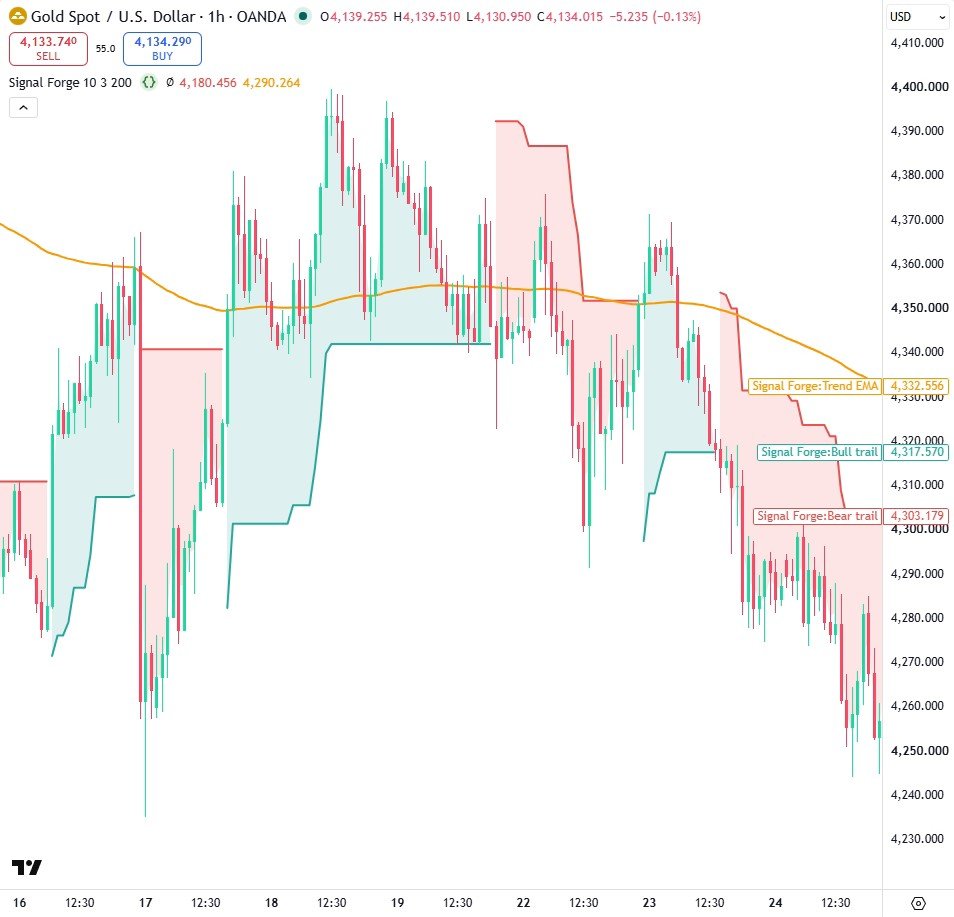
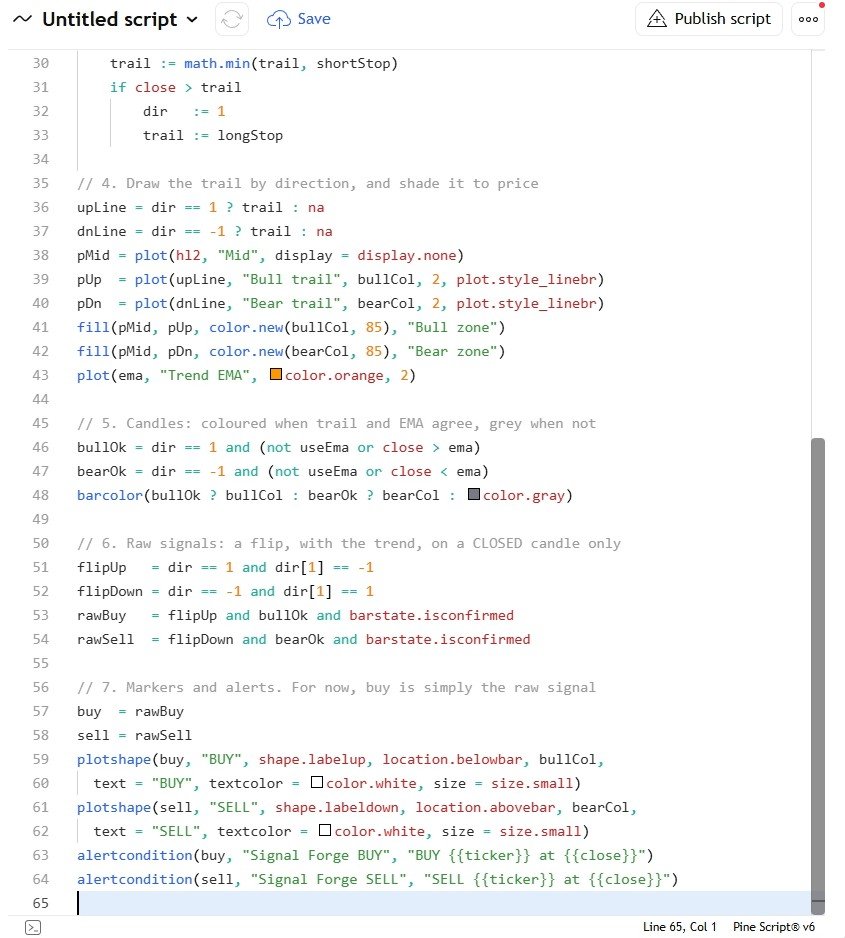
How it works
- An ATR trailing stop (length 10, multiplier 3) only ratchets in the trend's direction and flips when a candle closes through it.
- A 200 EMA acts as referee: a flip only becomes a signal when price is on the same side of the EMA, otherwise the candle is painted grey.
- Every signal is gated on barstate.isconfirmed, so BUY and SELL labels and alerts only fire on closed candles.
Settings
| Setting | Default | What it does |
|---|---|---|
| ATR length | 10 | ATR period for the trailing line |
| ATR multiplier | 3.0 | Distance of the trail from price, in ATRs |
| Trend EMA length | 200 | The referee EMA |
| Only signal with the EMA trend | true | Turn the EMA referee on or off |
| Bull colour / Bear colour | teal / red | Colours of the trail, shading and labels |
Source code
In TradingView: open the Pine Editor, create a new indicator, paste the code, then click "Add to chart".
//@version=6
// Signal Forge, part 1: the core engine. By Jayadev Rana.
indicator("Signal Forge", overlay = true)

// 1. Inputs: how far the trail sits, and the trend baseline
atrLen  = input.int(10, "ATR length", minval = 1)
atrMult = input.float(3.0, "ATR multiplier", minval = 0.5, step = 0.1)
emaLen  = input.int(200, "Trend EMA length", minval = 1)
useEma  = input.bool(true, "Only signal with the EMA trend")
bullCol = input.color(#26a69a, "Bull colour")
bearCol = input.color(#ef5350, "Bear colour")

// 2. Volatility and trend
atr = ta.atr(atrLen)
ema = ta.ema(close, emaLen)

// 3. The trail: it only ever moves in the trend's favour
longStop  = close - atrMult * atr
shortStop = close + atrMult * atr
var float trail = na
var int   dir   = 1
if na(trail)
    trail := longStop
else if dir == 1
    trail := math.max(trail, longStop)
    if close < trail
        dir   := -1
        trail := shortStop
else
    trail := math.min(trail, shortStop)
    if close > trail
        dir   := 1
        trail := longStop

// 4. Draw the trail by direction, and shade it to price
upLine = dir == 1 ? trail : na
dnLine = dir == -1 ? trail : na
pMid = plot(hl2, "Mid", display = display.none)
pUp  = plot(upLine, "Bull trail", bullCol, 2, plot.style_linebr)
pDn  = plot(dnLine, "Bear trail", bearCol, 2, plot.style_linebr)
fill(pMid, pUp, color.new(bullCol, 85), "Bull zone")
fill(pMid, pDn, color.new(bearCol, 85), "Bear zone")
plot(ema, "Trend EMA", color.orange, 2)

// 5. Candles: coloured when trail and EMA agree, grey when not
bullOk = dir == 1 and (not useEma or close > ema)
bearOk = dir == -1 and (not useEma or close < ema)
barcolor(bullOk ? bullCol : bearOk ? bearCol : color.gray)

// 6. Raw signals: a flip, with the trend, on a CLOSED candle only
flipUp   = dir == 1 and dir[1] == -1
flipDown = dir == -1 and dir[1] == 1
rawBuy   = flipUp and bullOk and barstate.isconfirmed
rawSell  = flipDown and bearOk and barstate.isconfirmed

// 7. Markers and alerts. For now, buy is simply the raw signal
buy  = rawBuy
sell = rawSell
plotshape(buy, "BUY", shape.labelup, location.belowbar, bullCol,
  text = "BUY", textcolor = color.white, size = size.small)
plotshape(sell, "SELL", shape.labeldown, location.abovebar, bearCol,
  text = "SELL", textcolor = color.white, size = size.small)
alertcondition(buy, "Signal Forge BUY", "BUY {{ticker}} at {{close}}")
alertcondition(sell, "Signal Forge SELL", "SELL {{ticker}} at {{close}}")
Watch it built
This script is written and explained step by step in the video lesson.
Need a custom indicator or strategy?
Non-repainting Pine Script v6, backtested with real costs, alert and webhook ready. Fixed quote within 24 hours.