Snapshots
How it works
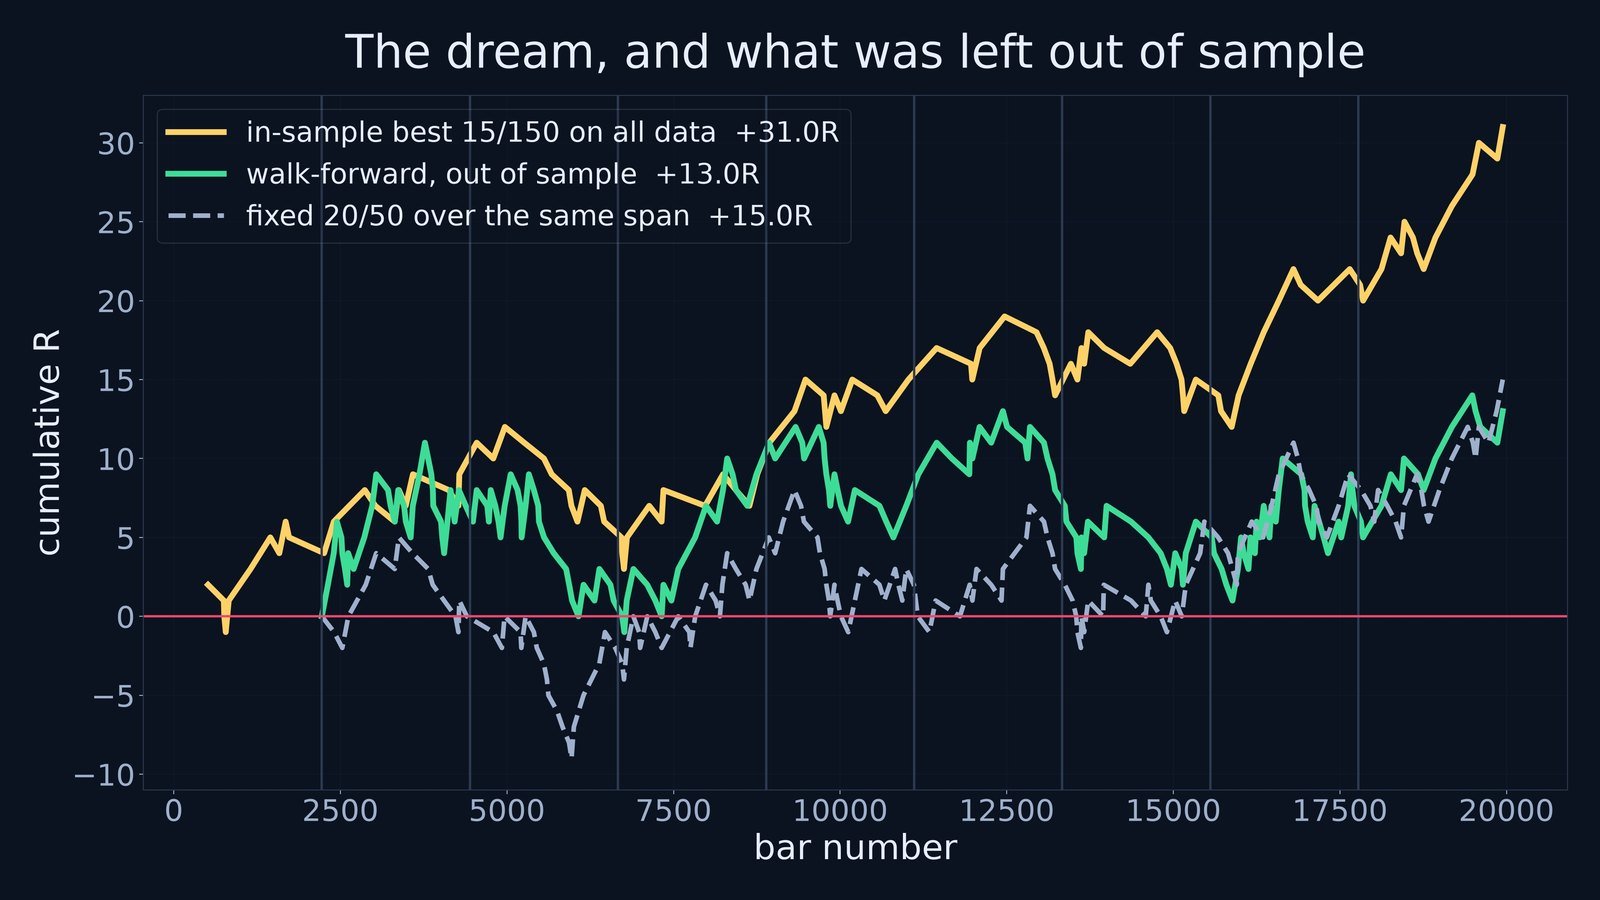
- The grid is scored on data the selection never saw, which is the only comparison that means anything.
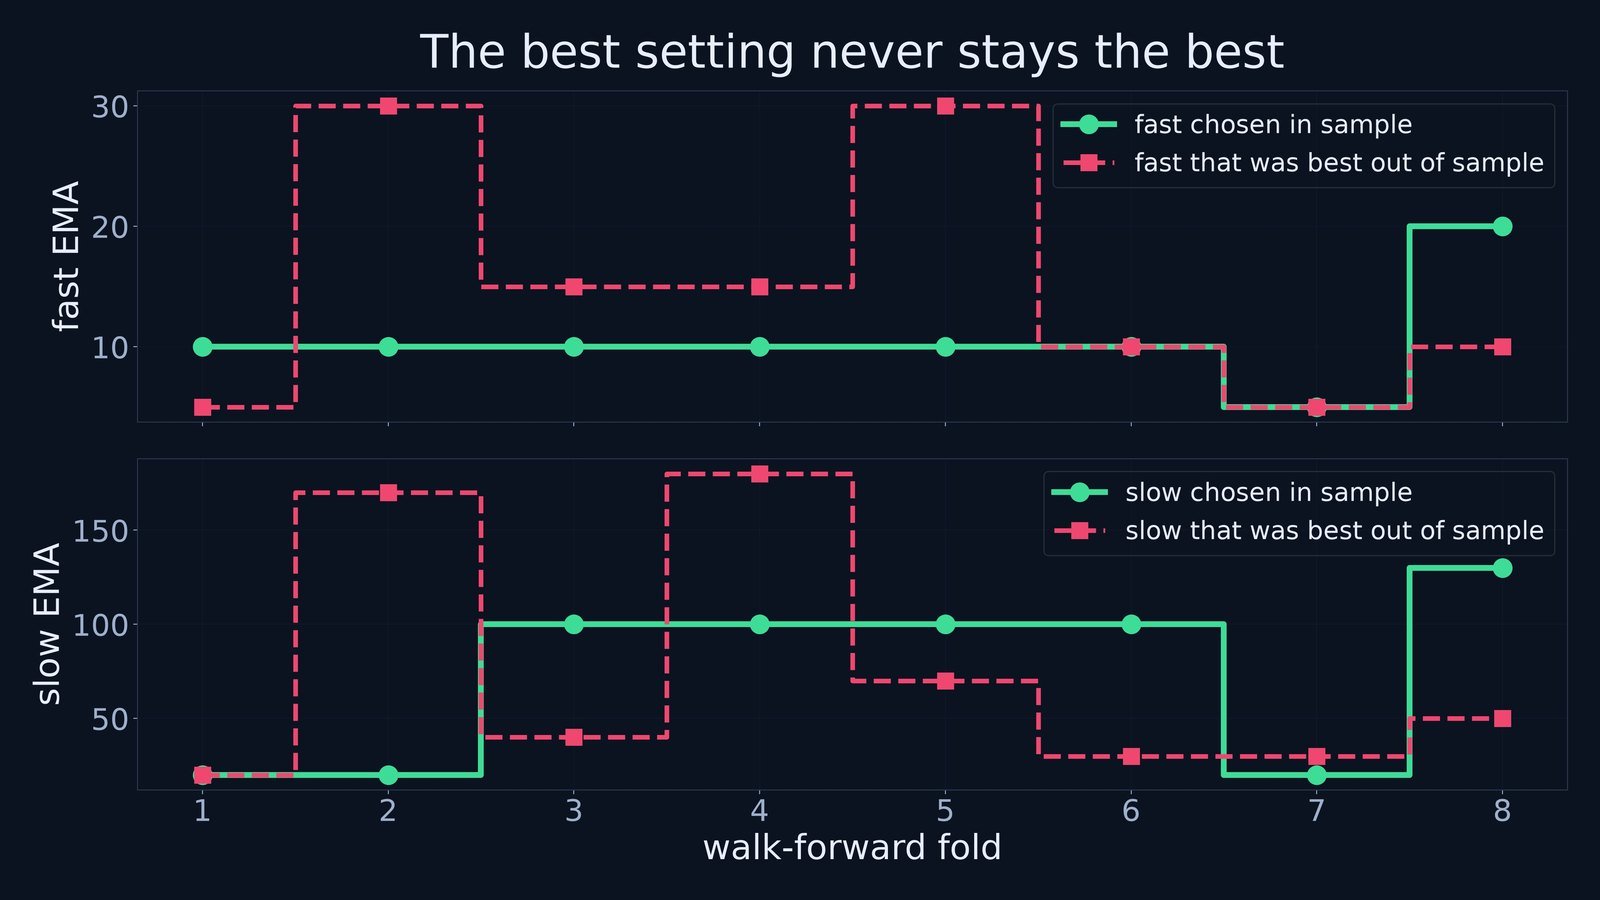
- Eight folds re-select in-sample and then trade forward, so the equity curve is a record of decisions, not of hindsight.
- The fixed 20/50 baseline is the control: if tuning cannot beat it out of sample, the tuning was noise.
Settings
| Setting | Default | What it does |
|---|---|---|
| Fast average | 15 | Fast moving-average length |
| Slow average | 150 | Slow moving-average length |
| Stop = ATR x | 2.0 | Stop distance, in ATRs |
| Target = R x | 2.0 | Target distance, as a multiple of the risk |
| Shade in-sample and out-of-sample | true | Tints the two halves so the split is visible |
Source code
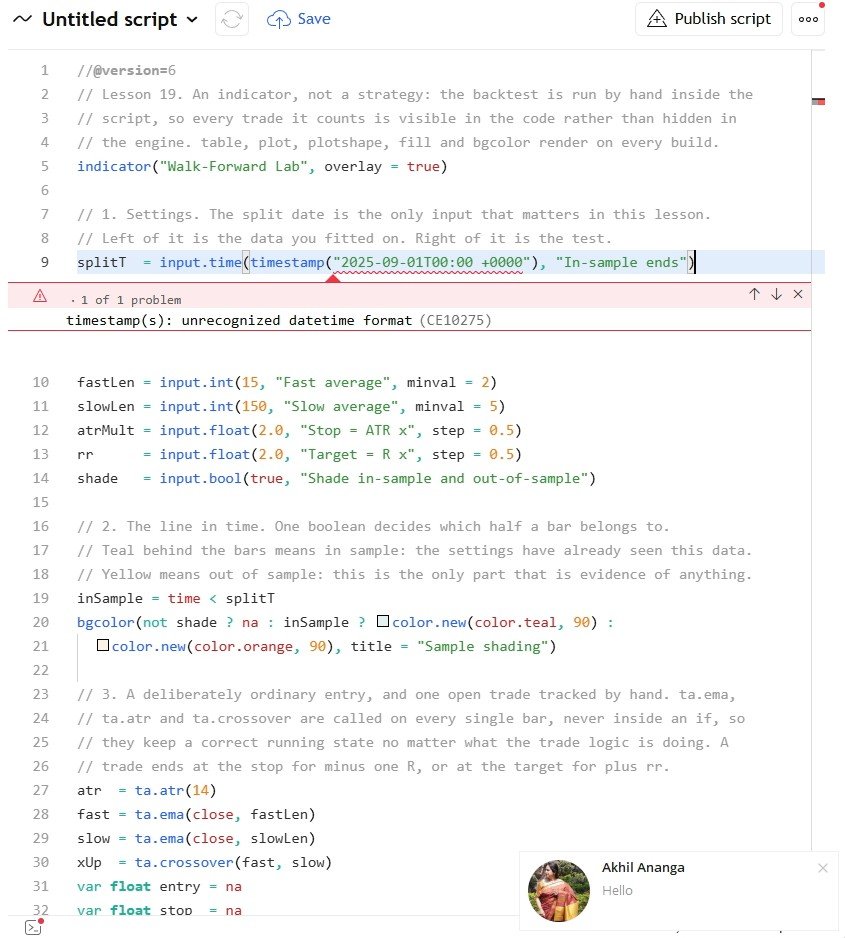
In TradingView: open the Pine Editor, create a new indicator, paste the code, then click "Add to chart".
//@version=6
// Lesson 19. An indicator, not a strategy: the backtest is run by hand inside the
// script, so every trade it counts is visible in the code rather than hidden in
// the engine. table, plot, plotshape, fill and bgcolor render on every build.
indicator("Walk-Forward Lab", overlay = true)

// 1. Settings. The split date is the only input that matters in this lesson.
// Left of it is the data you fitted on. Right of it is the test.
splitT  = input.time(timestamp("2025-09-01T00:00 +0000"), "In-sample ends")
fastLen = input.int(15, "Fast average", minval = 2)
slowLen = input.int(150, "Slow average", minval = 5)
atrMult = input.float(2.0, "Stop = ATR x", step = 0.5)
rr      = input.float(2.0, "Target = R x", step = 0.5)
shade   = input.bool(true, "Shade in-sample and out-of-sample")

// 2. The line in time. One boolean decides which half a bar belongs to.
// Teal behind the bars means in sample: the settings have already seen this data.
// Yellow means out of sample: this is the only part that is evidence of anything.
inSample = time < splitT
bgcolor(not shade ? na : inSample ? color.new(color.teal, 90) :
  color.new(color.orange, 90), title = "Sample shading")

// 3. A deliberately ordinary entry, and one open trade tracked by hand. ta.ema,
// ta.atr and ta.crossover are called on every single bar, never inside an if, so
// they keep a correct running state no matter what the trade logic is doing. A
// trade ends at the stop for minus one R, or at the target for plus rr.
atr  = ta.atr(14)
fast = ta.ema(close, fastLen)
slow = ta.ema(close, slowLen)
xUp  = ta.crossover(fast, slow)
var float entry = na
var float stop  = na
var float targ  = na
var array<float> rs = array.new<float>()
var array<int>   ts = array.new<int>()
var float lastR  = na
var bool  opened = false
var bool  closed = false
opened := false
closed := false
if na(entry)
    if xUp and atr > 0
        entry  := close
        stop   := close - atrMult * atr
        targ   := close + atrMult * atr * rr
        opened := true
else
    if low <= stop or high >= targ
        lastR := low <= stop ? -1.0 : rr
        array.push(rs, lastR)
        array.push(ts, time)
        entry  := na
        closed := true

// 4. Two buckets, filled on the last bar from the trade list and the timestamp
// each trade carries. Slot 0 is the in-sample half, slot 1 is out of sample, so
// the same code measures both halves and nothing can leak from one to the other.
var array<float> nTrade = array.new_float(2, 0)
var array<float> nWin   = array.new_float(2, 0)
var array<float> sumR   = array.new_float(2, 0)
var array<float> grossW = array.new_float(2, 0)
var array<float> grossL = array.new_float(2, 0)
if barstate.islast
    array.fill(nTrade, 0.0)
    array.fill(nWin, 0.0)
    array.fill(sumR, 0.0)
    array.fill(grossW, 0.0)
    array.fill(grossL, 0.0)
    if array.size(rs) > 0
        for i = 0 to array.size(rs) - 1
            r = array.get(rs, i)
            b = array.get(ts, i) < splitT ? 0 : 1
            array.set(nTrade, b, array.get(nTrade, b) + 1)
            array.set(sumR, b, array.get(sumR, b) + r)
            if r > 0
                array.set(nWin, b, array.get(nWin, b) + 1)
                array.set(grossW, b, array.get(grossW, b) + r)
            else
                array.set(grossL, b, array.get(grossL, b) - r)

// 5. What you actually see on the chart. The ribbon between the two averages is the
// signal, tinted by which half it is in, and the little markers are the entries and
// the closed trades, so you can watch winners thin out after the line.
p1 = plot(fast, "Fast average", color = color.new(color.silver, 30), linewidth = 2)
p2 = plot(slow, "Slow average", color = color.new(color.gray, 30), linewidth = 2)
fill(p1, p2, color = inSample ? color.new(color.teal, 80) :
  color.new(color.orange, 80), title = "Trend ribbon")
plotshape(opened, "Entry", shape.circle, location.belowbar,
  color.new(color.blue, 0), size = size.tiny)
plotshape(closed and lastR > 0, "Winner", shape.triangleup, location.belowbar,
  color.new(color.teal, 0), size = size.tiny)
plotshape(closed and lastR <= 0, "Loser", shape.xcross, location.abovebar,
  color.new(color.red, 0), size = size.tiny)

// 6. Small helpers for the report. A function may not assign to a global in Pine,
// so each of these only reads its arguments and hands back a value or a cell.
var table t = table.new(position.top_right, 3, 8, border_width = 1)
put(c, r, s, col, bg) =>
    table.cell(t, c, r, s, text_color = col, text_size = size.normal, bgcolor = bg)
pf(b) =>
    l = array.get(grossL, b)
    l > 0 ? array.get(grossW, b) / l : na
per(b) =>
    n = array.get(nTrade, b)
    n > 0 ? array.get(sumR, b) / n : na
txt(v, d) =>
    na(v) ? "-" : str.tostring(v, d == 0 ? "#" : d == 1 ? "#.#" : "#.##")

// 7. The report, drawn once on the last bar. Read it left to right: the middle
// column is the settings on the data they were fitted to, the right column is them
// on data they never saw, and the bottom row is how much of the edge survived.
if barstate.islast
    head = color.new(color.blue, 20)
    put(0, 0, "metric", color.white, head)
    put(1, 0, "IN SAMPLE", color.white, color.new(color.teal, 40))
    put(2, 0, "OUT OF SAMPLE", color.white, color.new(color.orange, 40))
    for b = 0 to 1
        n  = array.get(nTrade, b)
        w  = array.get(nWin, b)
        bg = b == 0 ? color.new(color.teal, 80) : color.new(color.orange, 80)
        put(b + 1, 1, txt(n, 0), color.white, bg)
        put(b + 1, 2, n > 0 ? txt(w / n * 100, 1) + "%" : "-", color.white, bg)
        put(b + 1, 3, txt(array.get(sumR, b), 1) + "R", color.white, bg)
        put(b + 1, 4, txt(per(b), 2) + "R", color.white, bg)
        put(b + 1, 5, txt(pf(b), 2), color.white, bg)
    put(0, 1, "trades", color.silver, color.new(color.black, 60))
    put(0, 2, "win rate", color.silver, color.new(color.black, 60))
    put(0, 3, "total R", color.silver, color.new(color.black, 60))
    put(0, 4, "R per trade", color.silver, color.new(color.black, 60))
    put(0, 5, "profit factor", color.silver, color.new(color.black, 60))
    keep = na(per(0)) or per(0) == 0 or na(per(1)) ? na : per(1) / per(0) * 100
    kcol = na(keep) ? color.silver : keep >= 100 ? color.teal : color.red
    put(0, 6, "edge kept out of sample", color.white, color.new(color.black, 40))
    put(1, 6, "", color.white, color.new(color.black, 40))
    put(2, 6, txt(keep, 0) + "%", kcol, color.new(color.black, 40))
    put(0, 7, "fitted on the left of the line, tested on the right", color.silver,
      color.new(color.black, 60))
    put(1, 7, "", color.silver, color.new(color.black, 60))
    put(2, 7, "", color.silver, color.new(color.black, 60))
Watch it built
This script is written and explained step by step in the video lesson.
Need a custom indicator or strategy?
Non-repainting Pine Script v6, backtested with real costs, alert and webhook ready. Fixed quote within 24 hours.