Snapshots
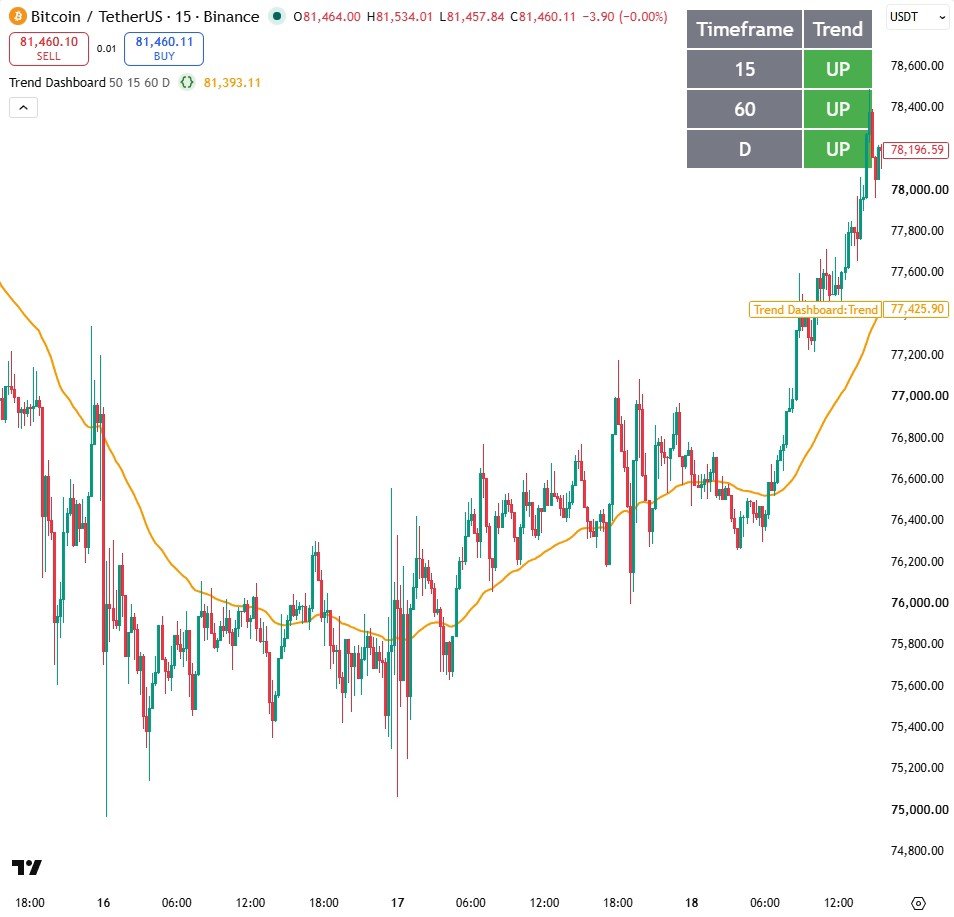
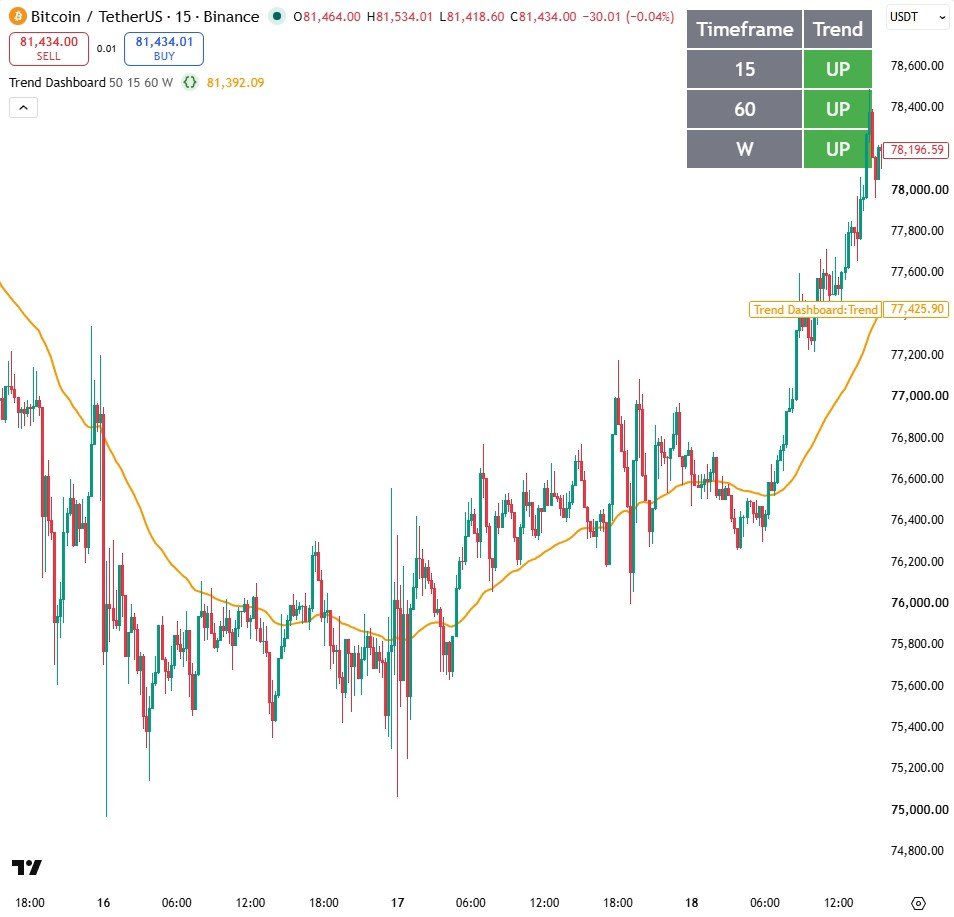
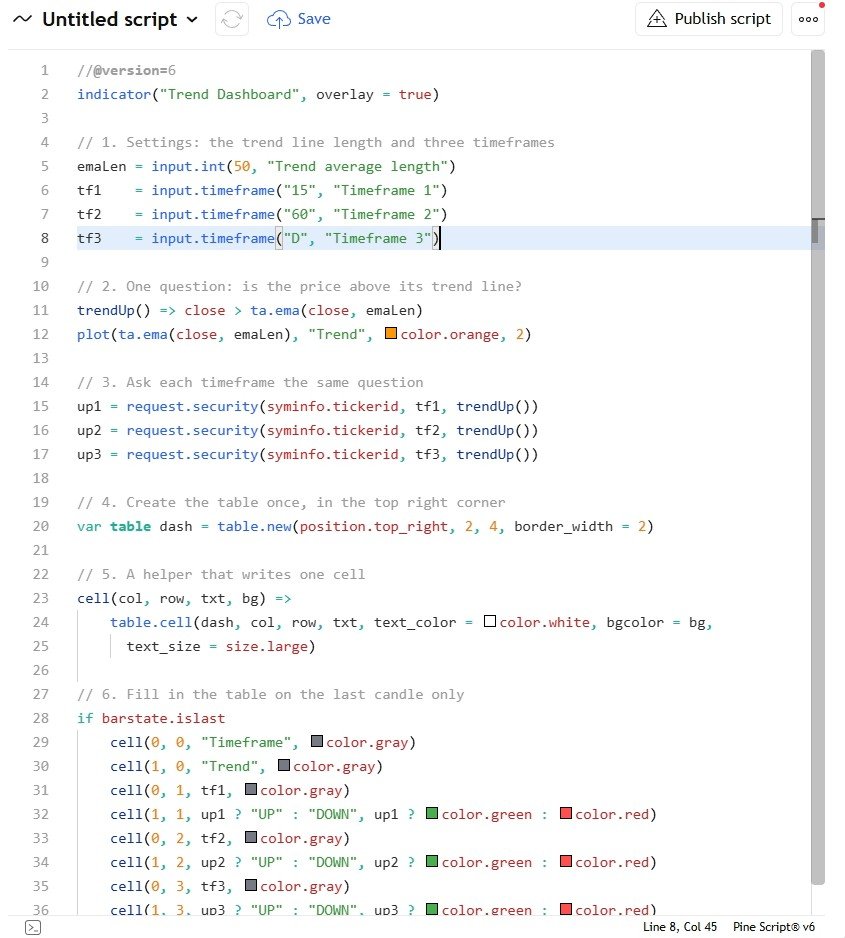
How it works
- A small trendUp() function asks one question: is the close above its EMA?
- request.security runs that same function on each of the three timeframes you choose.
- table.new with var creates the table once, and barstate.islast fills it in on the newest candle only.
Settings
| Setting | Default | What it does |
|---|---|---|
| Trend average length | 50 | Length of the EMA used on every timeframe |
| Timeframe 1 | 15 | The fastest timeframe row |
| Timeframe 2 | 60 | The middle timeframe row |
| Timeframe 3 | D | The slowest timeframe row |
Source code
In TradingView: open the Pine Editor, create a new indicator, paste the code, then click "Add to chart".
//@version=6
indicator("Trend Dashboard", overlay = true)

// 1. Settings: the trend line length and three timeframes
emaLen = input.int(50, "Trend average length")
tf1    = input.timeframe("15", "Timeframe 1")
tf2    = input.timeframe("60", "Timeframe 2")
tf3    = input.timeframe("D", "Timeframe 3")

// 2. One question: is the price above its trend line?
trendUp() => close > ta.ema(close, emaLen)
plot(ta.ema(close, emaLen), "Trend", color.orange, 2)

// 3. Ask each timeframe the same question
up1 = request.security(syminfo.tickerid, tf1, trendUp())
up2 = request.security(syminfo.tickerid, tf2, trendUp())
up3 = request.security(syminfo.tickerid, tf3, trendUp())

// 4. Create the table once, in the top right corner
var table dash = table.new(position.top_right, 2, 4, border_width = 2)

// 5. A helper that writes one cell
cell(col, row, txt, bg) =>
    table.cell(dash, col, row, txt, text_color = color.white, bgcolor = bg,
      text_size = size.large)

// 6. Fill in the table on the last candle only
if barstate.islast
    cell(0, 0, "Timeframe", color.gray)
    cell(1, 0, "Trend", color.gray)
    cell(0, 1, tf1, color.gray)
    cell(1, 1, up1 ? "UP" : "DOWN", up1 ? color.green : color.red)
    cell(0, 2, tf2, color.gray)
    cell(1, 2, up2 ? "UP" : "DOWN", up2 ? color.green : color.red)
    cell(0, 3, tf3, color.gray)
    cell(1, 3, up3 ? "UP" : "DOWN", up3 ? color.green : color.red)
Watch it built
This script is written and explained step by step in the video lesson.
Need a custom indicator or strategy?
Non-repainting Pine Script v6, backtested with real costs, alert and webhook ready. Fixed quote within 24 hours.