What this script is trying to do
A volatility-adjusted trend overlay built around an HMA backbone and ATR-driven trailing stop logic.
Traders who want the chart to show regime shifts clearly, not bury them under visual clutter.
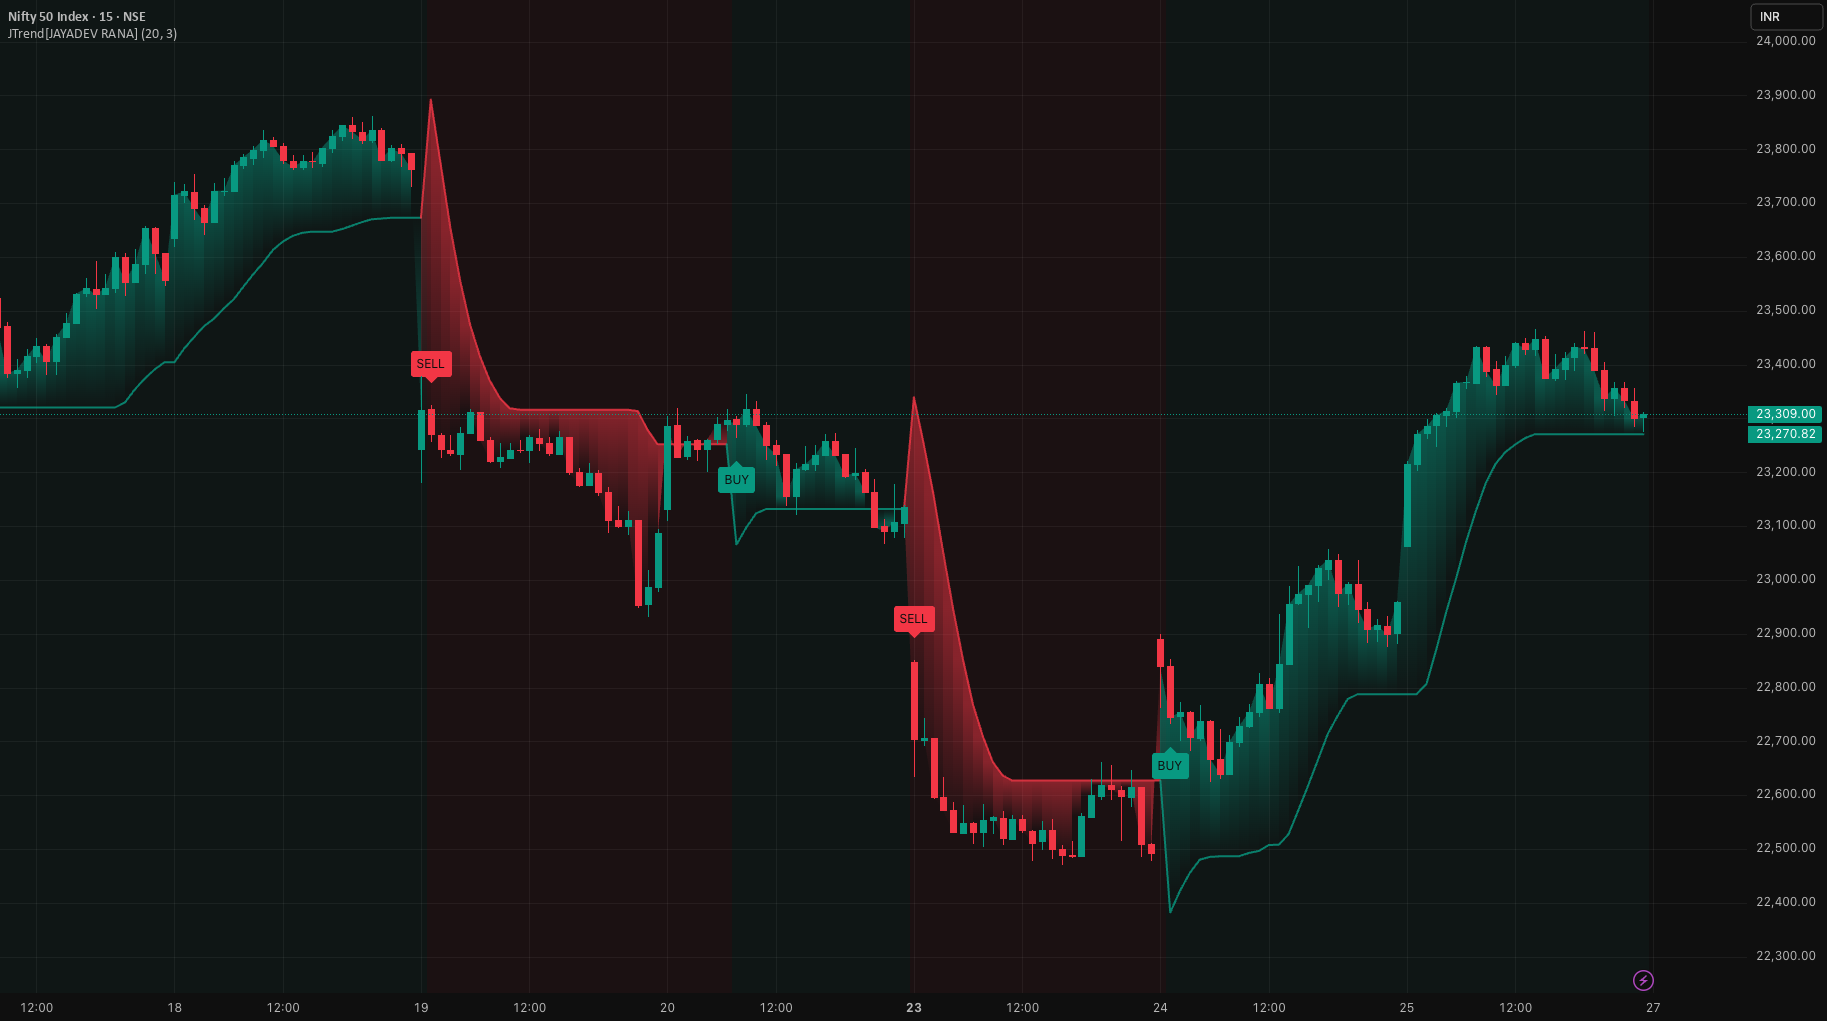
This script plots a volatility-adjusted trailing stop that tracks trend direction and highlights regime changes. It uses a Hull Moving Average of hl2 as the trend backbone, then builds an ATR-based channel around that HMA. The active trailing stop follows the lower band in bullish regimes and the upper band in bearish regimes.
What you can learn from the public version
The original TradingView page gives traders two useful things at once: a working example on chart and a chance to inspect real Pine work instead of only reading service copy.
The visible controls already tell you a lot. Inputs such as Public source is available directly on TradingView. make it easier to understand what the script is trying to manage in live use.
Bullish regime: The trailing stop is pulled upward using the lower ATR band. Price action above the stop, with the stop rising, generally indicates an uptrend environment.
Bearish regime: The trailing stop is pushed downward using the upper ATR band. Price action below the stop, with the stop falling, generally indicates a downtrend environment.
Flip signals:
A BUY label prints when the regime flips from bearish to bullish (HMA crosses above the trailing stop).
A SELL label prints when the regime flips from bullish to bearish (HMA crosses below the trailing stop).
Engineering notes from the script
- Published as a TradingView indicator, which makes it easy for traders to inspect the logic, add it to chart, and decide whether they want a custom private version later.
- This matters because traders can inspect real public TradingView work before deciding whether they need a custom paid build.
Compute HMA(hl2, Trend Length) as the trend reference.
Compute ATR(Trend Length) for volatility.
Build bands around the HMA:
Upper band = HMA + ATR * Multiplier
Lower band = HMA - ATR * Multiplier
Maintain a stateful trailing stop that:
In a rising context, steps up using the lower band (with a “never decreases” behavior).
In a falling context, steps down using the upper band (with a “never increases” behavior).
Determine trend direction from HMA vs trailing stop, and trigger flip labels on crossovers/crossunders.
Best use cases and practical caution
- Directional traders using volatility-adjusted trailing logic.
- People who want readable BUY/SELL regime flips on chart.
- Anyone studying how Jayadev packages premium-style visuals in a free public release.
What to watch before you trust it live
- Trailing systems can flip more often in unstable ranges.
- ATR-based trend tools still need position sizing and risk control outside the indicator.
In sideways or choppy conditions, any crossover-based trend tool can produce rapid flip signals (whipsaws).
Alerts and labels are based on crossover logic that can change on the current real-time bar until it closes (standard TradingView behavior).
Using the same length for HMA and ATR is intentional here, but different markets/timeframes may require tuning.
Screenshot prompt pack
Clean trend regime example: Show a strong directional move (e.g., BTCUSD 1H or a major index 1D) with the trailing stop clearly tracking and a single BUY then later SELL flip.
Chop/whipsaw example: Show a ranging market segment where multiple flips occur; annotate it as a “range condition” limitation screenshot.
Settings comparison: Two screenshots of the same chart/timeframe—one with a lower ATR multiplier (tighter stop) and one with a higher multiplier (wider stop)—to demonstrate sensitivity.
Visuals showcase: Screenshot focusing on the gradient fill + background regime shading with labels visible (no other indicators on chart).
What this says about the way Jayadev Rana works
There is a big difference between saying you write Pine Script and publishing work people can inspect on their own charts. These open-source releases show the public side of Jayadev Rana’s work: ideas shared freely, visible chart behavior, and clear explanations around what the script is doing.
If the free version gets close to what you want but not all the way there, the useful move is to treat it as a reference point. From there, the custom build can be shaped around cleaner rules, better safeguards, broker routing, or a more production-ready workflow.
ATRPrice Volume Trend (PVT)supertrendTrend Analysis